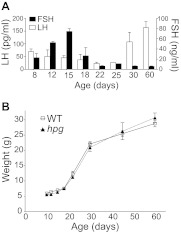
Fig. 1.
Developmental changes in body weight and serum gonadotropin profiles in female mice. A, Serum LH (white bars) and FSH (black bars) levels in WT female mice across postnatal development, with a significant variation across age for both LH (P < 0.0029) and FSH (P < 0.0001; ANOVA). B, Growth rate as reflected by body mass across postnatal development from P10 to P60 in WT and hpg female mice, with significant variance across age (P < 0.0001), without effect of genotype (P > 0.05) or interaction between age and genotype (P > 0.05; two way ANOVA).

