Figure 1.
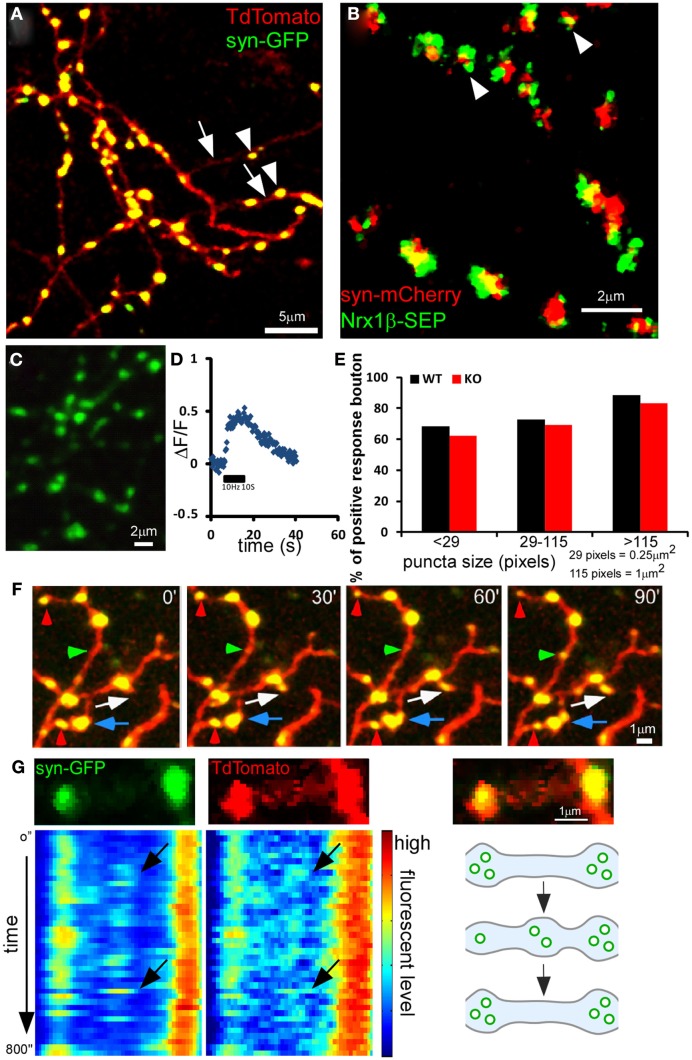
Dynamics of presynaptic boutons and synaptic vesicle pools in developing GABAergic axons. Cortical organotypic slice cultures were biolistically transfected at ∼EP14 and two-photon images were taken at ∼EP18 at 910 nm for GFP or 990 nm for mCherry. Representative images are shown. (A) Axons of a basket neuron transfected with PG67-TdTomato and PG67-syn-GFP. Arrows indicate axon shafts and arrowheads indicate boutons and syn-GFP puncta. (B) Axons of a basket neuron transfected with Lox-STOP-Lox(LSL)-NRX1β-SEP and LSL-syn-mCherry in slice cultures from PV-ires-Cre mice. Note that almost all syn-mCherry puncta contain NRX1β-SEP (arrowheads). (C) Axons of a basket neuron transfected with LSL-syn-SEP using slice culture of PV-ires-Cre mice. (D) Representative fluorescent level changes on a single bouton along a basket cell axon expressing syn-SEP, after a 10s 10 Hz stimulation. (E) Syn-SEP was expressed in PV-ires-Cre slice culture from EP15, and the expressing neurons were patch clamped and imaged at EP20. Fluorescent changes on single boutons were recorded during and after 10s of 10 Hz stimulation. Boutons showed significant positive increase of fluorescent was quantified for both WT (182 boutons from seven cells) and GABAB1flx/flx::PV-ires-Cre slice culture (218 boutons from seven cells). Fisher’s-exact test of the proportion of functional boutons in both WT and GABABR KO neurons in different size population showed no significant difference. (F) Axon terminals in (A) were imaged at 30 min intervals. Red arrowheads indicate boutons that shrink and diminish their syn-GFP signal. Green arrowheads indicate bouton that enlarge and accumulate syn-GFP. The blue arrow indicates newly formed boutons that split from a larger bouton. The white arrow indicates a newly formed bouton on a newly grown branch. (G) The dynamics of syn-GFP puncta closely correlated with that of TdTomato. The top row shows a small portion of an axon branch bearing two boutons (TdTomato) containing syn-GFP puncta (left) and the merged view (right). The kymographs show the dynamic changes of syn-GFP and TdTomato signal in the two boutons in a 800-s movie with 20 s interval. Each horizontal line in the kymograph represents the signal from one time point. Note the moment-to-moment correspondence of signal fluctuations in syn-GFP and TdTomato (black arrows). The bottom right panel shows a schematic of the dynamic changes in (G).

