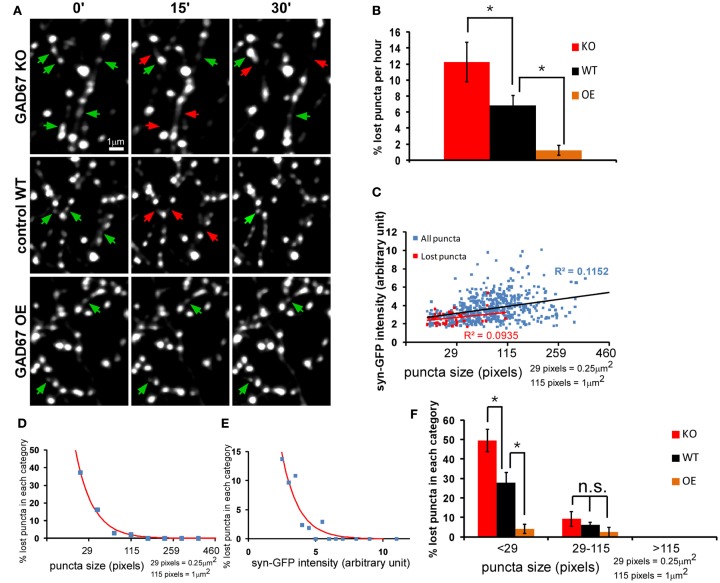
Figure 3.
The strength of GABA transmission regulates the stability of nascent syn-GFP puncta. Cortical slice cultures of GAD67flx/flx mice were biolistically transfected at ∼EP15 with PG67-syn-GFP and PG67-TdTomato. GAD67 overexpression (OE) was achieved by including an additional PG67-Gad67 construct. Single basket cell GAD67 knockout was achieved by including an additional PG67-Cre construct. (A) Sparsely labeled basket neurons were imaged at EP18-20 at 15 min interval for 1 h. Representative images of the first half hour were shown. Red arrows indicate the disappeared puncta, and green arrows indicate appeared and persistent puncta. (B) The percentage of lost puncta was analyzed as described in the Section “Materials and Methods.” (KO: 6 cells, 476 puncta; WT: 5 cells, 565 puncta; OE: 4 cells, 406 puncta; one-way ANOVA P = 0.006, post hoc Dunn’s test, *p < 0.05) (C) The syn-GFP puncta size vs. signal intensity for all puncta (blue dots) and for lost puncta (red dots) in WT basket cells (565 puncta for all puncta, 39 lost puncta). Linear regression was applied for both groups and R2 were displayed. (D) The size of all syn-GFP puncta and lost puncta of WT cells was binned. The number of lost puncta in each category was divided by the number of total syn-GFP puncta in that category to derive the percentage of lost puncta in that category. The red line is the fitted curve with function y = a × exp(−x/b). (E) The intensity of all syn-GFP puncta and lost puncta was binned with arbitrary unit. The number of lost puncta in each category was divided by the number of total puncta in that category to calculate the percentage of lost puncta. The red line is the fitted curve with function y = a × exp(−x/b). (F) Both the whole syn-GFP puncta population and the lost puncta population were classified according to their size. The percentage of lost puncta in each category was determined as the number of lost puncta in that category divided by the number of total puncta in that category. Significant change was only found in the <29-pixels group (one-way ANOVA P = 0.0002, post hoc Dunn’s test, *p < 0.05).

