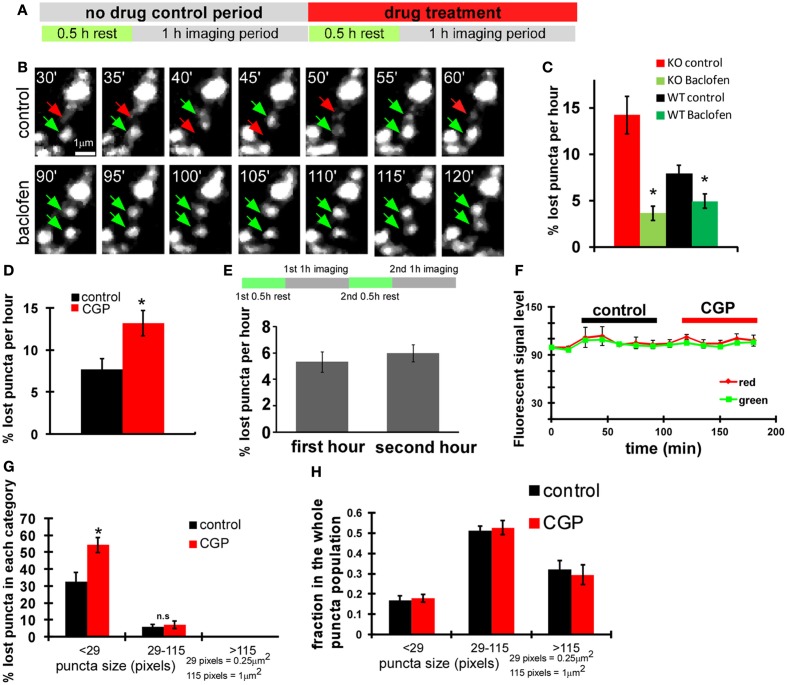
Figure 4.
GABABR in basket cells regulates the stability of nascent syn-GFP puncta. (A) Scheme of imaging experiments with drug treatment. (B) Acute baclofen (10 μM) treatment rescued unstable syn-GFP puncta in GAD67−/− cells transfect with the PG67-Cre construct using slice cultures from GAD67flx/flx mice. Representative images at the indicated time points of the same set of puncta were shown. Red arrows and green arrows indicate the disappeared puncta and the present puncta, respectively. (C) The percentage of lost puncta was quantified for both WT and GAD67−/− KO basket neurons under control condition and baclofen treatment (n = 7 cells, t-test P = 0.002 for KO, P = 0.026 for WT, comparing with corresponding control group). (D) Using slice cultures from PV-ires-Cre mice, PV basket neurons labeled by LSL-syn-GFP and LSL-DsRed were imaged first under control condition and then under 10 μM CGP treatment. The percentage of lost puncta was quantified (n = 6 cells, t-test P = 0.002). (E) Bouton dynamics did not change significantly during the second 1 h imaging session under control condition. Cortical PV neurons were labeled with LSL-syn-GFP and LSL-DsRed using slice cultures from PV-ires-Cre mice. The two imaging sessions were conducted as depicted in the diagram, and the lost syn-GFP puncta were quantified (n = 3 cells). (F) CGP treatment did not significantly quench fluorescence protein signal. For neurons analyzed in (D,E), syn-GFP and RFP intensity on 10 randomly picked boutons were followed for all time points. The change of fluorescence levels on the same bouton was analyzed by normalizing with the initial fluorescence signal, which was normalized as 100. (G) For neurons imaged in (D), the percentage of lost puncta was plotted according to their size described in Figure 3F (n = 6 cells, t-test P = 0.001). (H) Acute CGP treatment did not change the puncta size distribution. For neurons analyzed in Figure 4D, puncta were classified according to size. The fraction of each size category over the whole puncta population was calculated and plotted. The analysis was done for the 30- and 180-min time points, according to the X axis in (F) (n = 3 cells).

