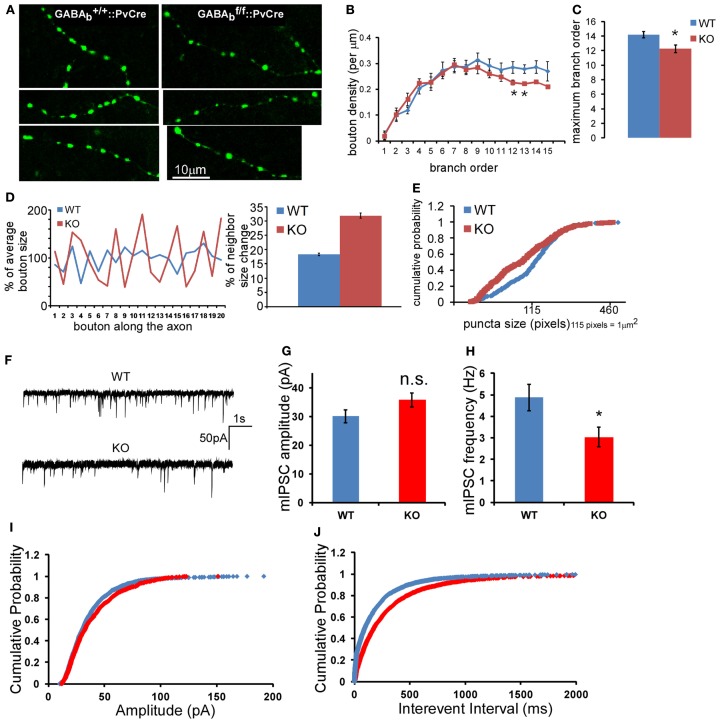
Figure 9.
GABABR deficiency in PV neurons results in aberrant density and size distribution of presynaptic terminals in vivo. (A) Morphology of axon branches and presynaptic boutons of control (left panels) and GABAB1−/− (right panels) PV neurons in layer 2/3 of visual cortex were labeled by biocytin at P40; mouse genotypes are as indicated. (B) The bouton density (# of bouton per μm) on different axon branch order was analyzed for all reconstructed neurons (*P < 0.05, comparing with WT neuron). (C) The average maximum axon branch order for all reconstructed neurons (*P = 0.01, n = 9 for WT, n = 8 for KO). (D) The size change of consecutive boutons along one axon branch was plotted for WT and GABAB1−/− KO PV cells. The average bouton size of each branch was normalized as 100%. The percentage of neighbor size change was calculated as described in the Section “Materials and Methods” and was plotted. Data were from 11 axons segments of three cells of both WT and KO neurons, which contained 268 boutons in WT axons and 246 boutons in KO axons (Student t-test, P < 0.0001). (E) Boutons of terminal axon branches of both WT and KO neurons were quantified, and the cumulative probability of bouton size distribution was plotted (332 boutons for WT, 328 boutons for KO; K-S test, P < 0.0001). (F) Sample traces of mIPSC recorded from layer 2/3 pyramidal neurons WT and GABABR KO animals. (G) Average mIPSC amplitude of all recorded neurons. (H) Average mIPSC frequency of all recorded neurons (n = 15 for each group, P = 0.02, five WT mice and five KO mice). (I) The cumulative distribution of mIPSC amplitude. (J) The cumulative distribution of mIPSC inter-event interval (K-S test, P < 0.001).

