
Figure 5.
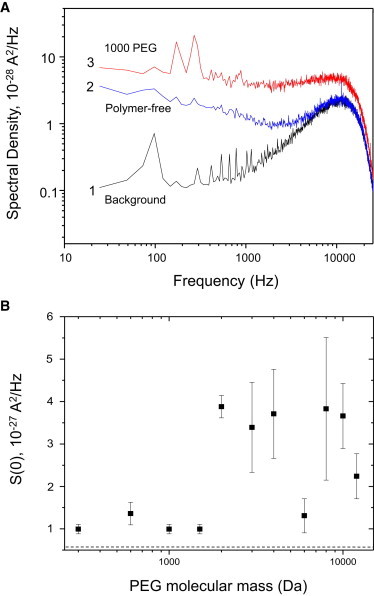
Power-spectrum analysis of noise in the engineered FhuA ΔC/Δ4L protein nanopore. (A) Representative power spectra at +100 mV. Trace 1 represents power spectra taken at 0 mV, trace 2 the power spectrum of a single FhuA ΔC/Δ4L nanopore in PEG-free solution and at +100 mV, and trace 3 the power spectrum of a single FhuA ΔC/Δ4L nanopore in solution containing 1000-Da PEG at +100 mV. Note that the PEG-containing solution has a greater noise level. The sharp cutoff at 10,000 Hz is due to the Bessel filter. (B) Trace indicates the excess S(0) noise in the power spectra of FhuA ΔC/Δ4L with PEG solutions. S(0) values were taken at +100 mV by averaging of the spectral values in the range 100–1000 Hz. Displayed values of each channel are calculated by subtracting the S(0) value at 100 mV from that at 0 mV. The horizontal dashed line represents baseline S(0) noise for PEG-free FhuA ΔC/Δ4L. Results indicate that PEG-induced noise is highest in the impermeable regime.