
Figure 4.
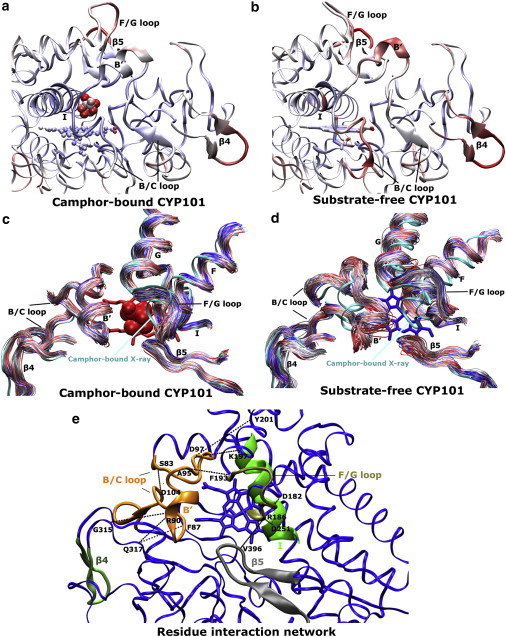
Average structures of (a) camphor-bound and (b) substrate-free CYP101 obtained from MD simulations colored by atomic root-mean-square fluctuations in a grayscale (color-scale online: 0 Å, blue; midpoint, white; and 1.2 Å, red). The structures are rotated from Fig. 1a so as to look down the I-helix for better viewing of the five regions. Time series of backbone traces of the five protein regions during 100-ns MD trajectories of (c) camphor-bound and (d) substrate-free CYP101 in a grayscale (color-scale online: 0 ns, blue; midpoint, white; and 100 ns, red). The closed 3L63 crystal structure is shown as reference. (e) Key salt-bridge, hydrogen-bonding, and hydrophobic interactions in CYP101, in which the five regions are shown similar to Fig. 1a.