
Figure 2.
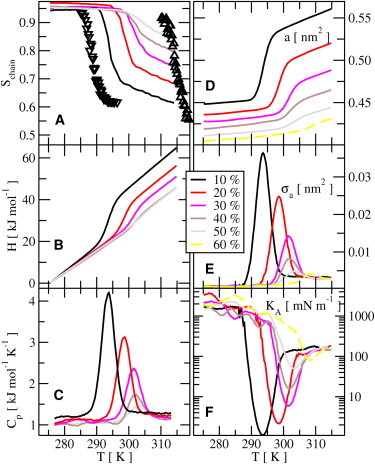
Simulated annealing results. (A) Order parameter versus temperature for different concentrations of cholesterol. (B) Enthalpy versus temperature for different concentrations of cholesterol. (C) Heat capacity Cp, calculated from Eq. 6 versus temperature. (D) Area per lipid versus temperature. (E) Area fluctuations per lipid versus temperature. (F) Area compressibility modulus (calculated from Eq. 5) versus temperature. For all quantities, there is a hysteresis of ±15 K when passing through the transitions. (A, up- and downtriangles) Order parameters during the cooling and heating through the phase transition for the cholesterol-free system. Otherwise, all quantities are monitored during the downwards (freezing) transition.