
Figure 5.
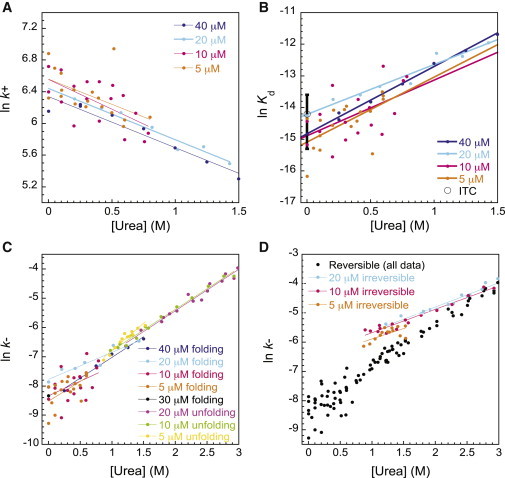
(A–C) Dependence of the association rate constant (A), equilibrium dissociation constant (B), and dissociation rate constant (C) on urea concentration. Values are extracted from fitting the reversible model. (D) Dissociation rate constants obtained from the reversible model are compared to apparent rate constants extracted from fits to an irreversible model. Note that the apparent noisiness of the data comes from the fact that each data point represents fitting of an individual kinetic trace. We have included even very low concentration data points in the figure legend to demonstrate that all the resultant parameters are essentially protein concentration independent. In (B), the Kd from ITC experiments is included for comparison, the error bar represents the standard deviation for three independent experiments.