
Figure 3.
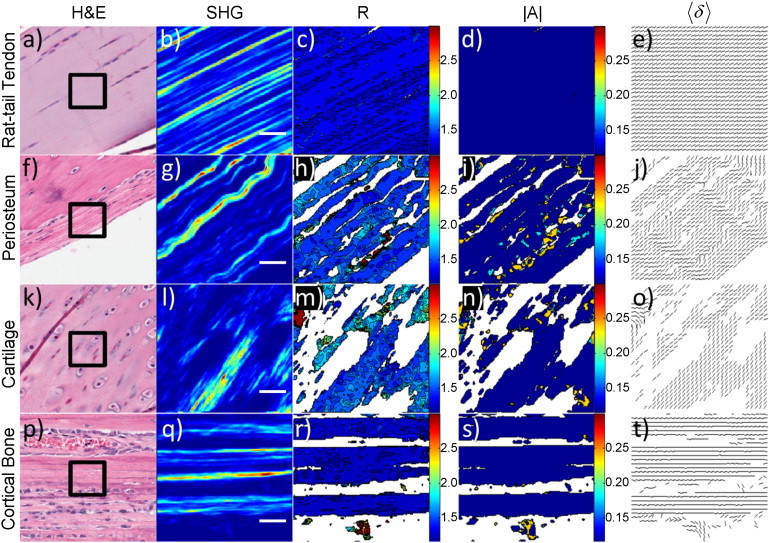
PIPO parameters in tissues with parallel collagen fibril distributions. (Rows a–e) Rat-tail tendon, (rows f–j) periosteum, (rows k–o) tibia cartilage, and (rows p–t) tibia cortical bone, respectively. (a, f, k, and p) White-light images of H&E stained sections. (Black box) 50 × 50 μm2 region similar to the SHG images in panels b, g, l, and q. (c, h, m, and r) Corresponding R-ratio images. Coloring corresponds to the R-ratio value and the color-bar ranges from a ratio of 1.2–3.0. (d, i, n, and s) Corresponding |A|-ratio images, where the coloring ranges from 0 to 0.3. (e, j, o, and t) Corresponding fibril orientation images. Each line indicates the direction of the 〈δ〉. (White space) Absence of a ratio. The scale bar is 10 μm.