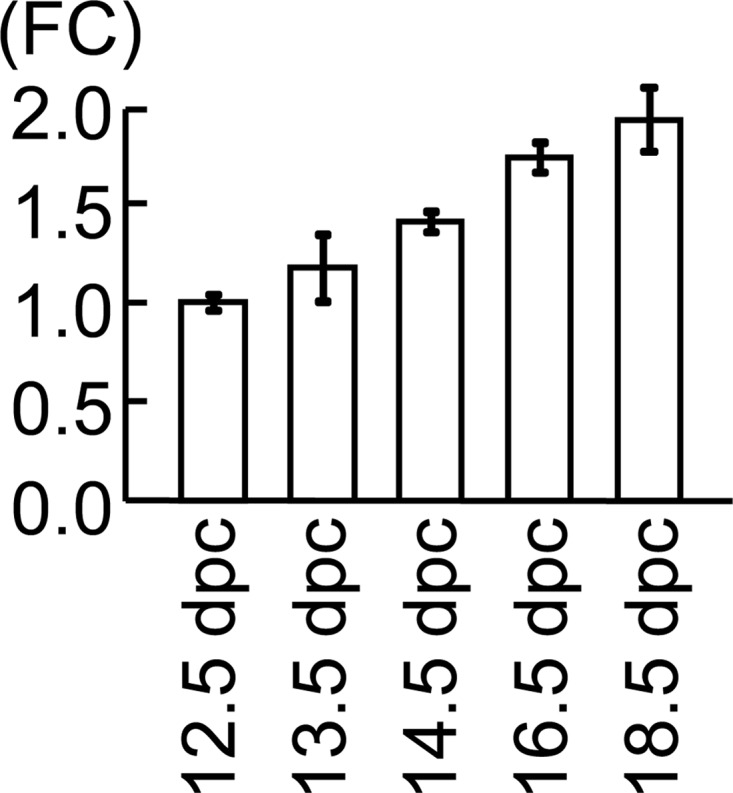
Fig. 2.

Testicular Mamld1 expression levels during the latter half of the fetal life in WT male mice. Figure indicates the data obtained by real-time RT-PCR analyses. Fold change (FC) represents relative mRNA levels of Mamld1 against Gapdh. The relative expression level of Mamld1 mRNA at 12.5 dpc was designated as 1.0.
