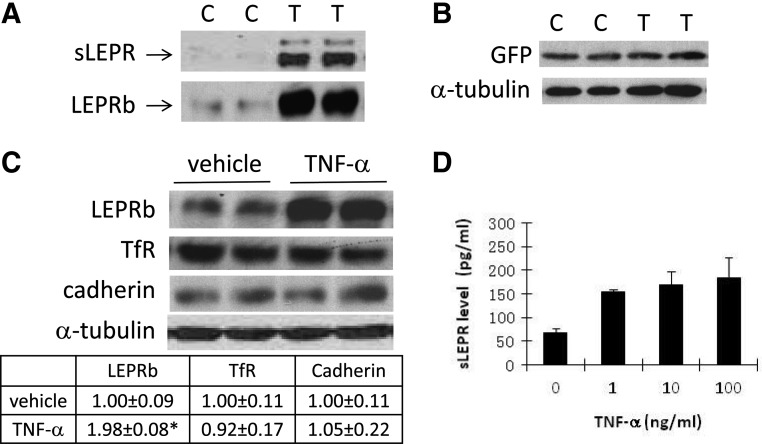
Fig. 2.
TNF-α up-regulates LEPRb protein level and sLEPR releases through ectodomain shedding of LEPRb. Panel A, Western blot analysis of LEPRb in cell lysates and sLEPR in CM. Ad-LEPRb-infected HEK293 cells were treated for 15 h with 20 ng/ml TNF-α (T) or vehicle control (C) before the analysis. Panel B, Western blot analysis of GFP and a-tubulin levels in cell lysates. HEK 293 cells infected with Ad-GFP were treated with TNF-α (T) or vehicle (C) the same as in A before the analysis. Panel C, Western blot analysis of LEPRb, the endogenous TfR, cadherin, and α-tubulin levels. Ad-LEPRb-infected HEK293 cells were treated for 6 h with vehicle or 50 ng/ml TNF-α before the analysis. The table below the gel image shows the levels of LEPRb, TfR, and cadherin, normalized by the respective α-tubulin levels of the cells, and relative to those of vehicle-treated cells as determined by densitometry. *, P < 0.05. Panel D, ELISA analysis of sLEPR levels in CM. Ad-LEPRb-infected HEK293 cells were treated for 6 h with the indicated concentrations of TNF-α. CM were collected for ELISA analysis.

