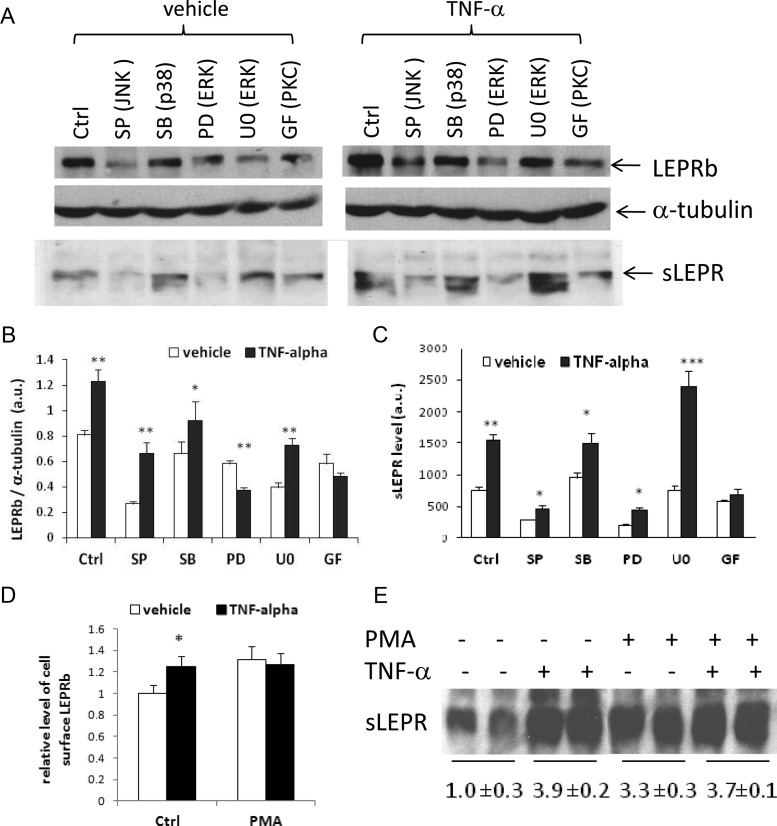
Fig. 7.
PKC activity is required for the stimulatory effects of TNF-α on LEPRb expression and sLEPR release and activation of PKC by PMA mimics the TNF-α effect. A, Western blot analysis of LEPRb levels in cell lysates and sLEPR levels in CM. Ad-LEPRb-infected HEK293 were pretreated with the specific inhibitors, 50 μm SP600125 (SP) (JNK), 10 μm SB202190 (SB) (p38 MAPK), 50 μm PD98059 (PD) and 5 μm U0126 (U0) (ERK), and 10 μm GF109203X (GF) (PKC) for 30 min followed by vehicle (−) or 50 ng/ml TNF-α (+) treatment for 6 h before Western blot analysis. B, Average LEPRb levels in the cell lysates shown in A and a duplicate set of samples, determined by densitometry and expressed as ratios of LEPRb to α-tubulin. *, P < 0.05; **, P < 0.01, vehicle- vs. TNF-α-treated cells, respectively. C, Average sLEPR levels in the CM shown in A and a duplicate set of samples, determined by densitometry and expressed in arbitrary units. *, P < 0.05; **, P < 0.01; ***, P < 0.001, vehicle- vs. TNF-α-treated cells, respectively. D, FACS analysis of cell surface LEPRb levels. Ad-LEPRb-infected HEK293 cells were treated with TNF-α (50 ng/ml), PMA (1 μg/ml), both, or neither for 2 h. Cell surface LEPRb proteins were labeled with anti-FLAG antibody followed by fluorescein isothiocyanate-conjugated secondary antibody, and quantified by FACS. Average cell surface LEPRb levels of a triplicate set of samples are shown. E, Western blot analysis of sLEPR levels in CM. Ad-LEPRb-infected HEK293 cells were treated with TNF-α (50 ng/ml), PMA (1 μg/ml), both, or neither for 14 h. CM were collected for Western blotting analysis. The average sLEPR levels of two duplicate sets of samples, including one set for which a gel image is not shown, relative to that of the control samples (untreated with TNF-α or PMA), are shown below the gel image. Ctrl, control.

