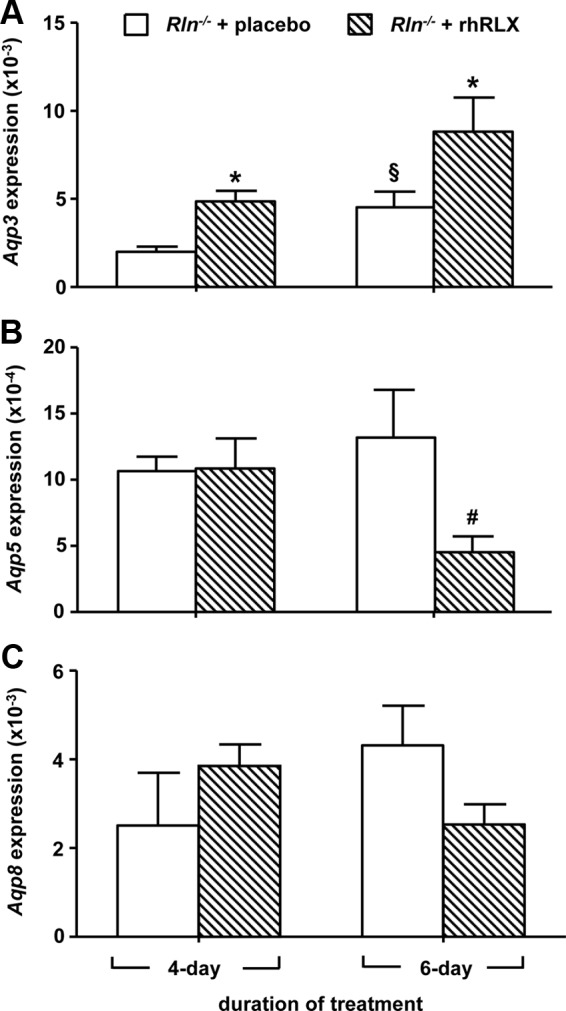
Fig. 6.

Aqp3 (A), Aqp5 (B), and Aqp8 (C) in the cervix of pregnant Rln−/− mice treated with placebo (white bars) or rhRLX (hatched bars) for 4 and 6 d. QPCR data are normalized to the reference gene Rn18s and presented as mean ± sem as calculated using the 2−ΔCT method (n = 5/group). *, P < 0.05 higher vs. Rln−/− placebo; #, P < 0.05 lower vs. Rln−/− placebo; §, P < 0.05 higher vs. 4-d Rln−/− rhRLX.
