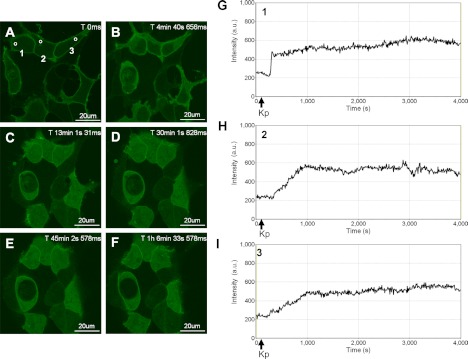
Fig. 1.
Spatiotemporal characteristics of GFP-PH-PLC-δ1 in HEK 293 cells in response to KISS1R activation. A–F, Representative images selected from a time series of laser-scanning confocal microscopic images showing the plasma membrane and cytosolic localization of GFP-PH-PLC-δ1 in KISS1R-expressing HEK 293 cells in the absence of agonist (0 s) and in response to 100 nm Kp-10 treatment approximately 1 min later (see solid black arrows on x-axis of panels G–I). Cytosolic regions of interest in three cells (shown by small white circles in panel A) were analyzed quantitatively by determining the changes in GFP fluorescence over time. These changes are presented graphically (G–I). These studies were conducted five independent times, and representative images from one independent experiment are shown. ms, Millisecond; s, second.

