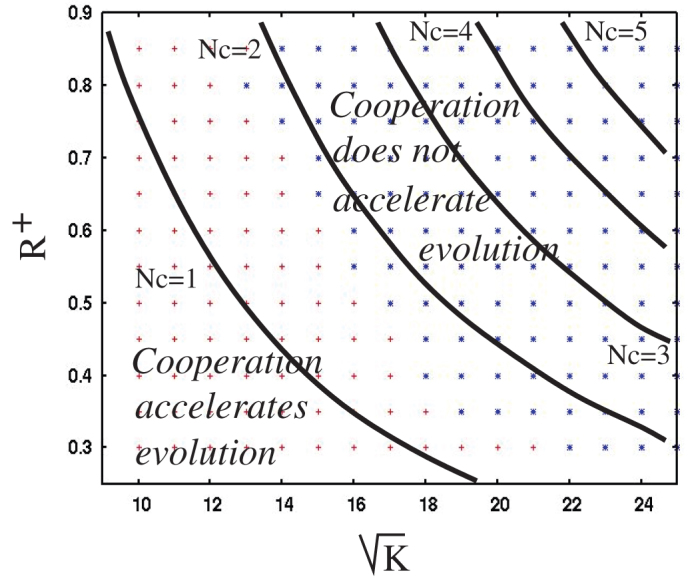
Figure 5. Parameter dependence of the division of labor dynamics compared with the sequential evolution scenario.

Varied are parameters K (the neighborhood size, defining the cooperation and reproduction radii) and R+ (the enhanced fitness of cooperators). Crosses and snowflakes show results of numerical simulations. Crosses correspond to the cases where m-hit mutant is created significantly faster in the division-of-labor scenario compared to the sequential evolution. Snowflakes correspond to the cases where division of labor does not accelerate the emergence of m-hit mutants. For each point, 10 simulations were run both under the division of labor and sequential evolution scenarios. Solid lines are theoretical results from equation (1), showing the levels of the quantity Nc, the number of cooperators per site per neighborhood. Other parameters are m = 5, f = 1/40, u = 3.17×10⁻³, R− = 0.135, R = 0.15, d = 0.1.
