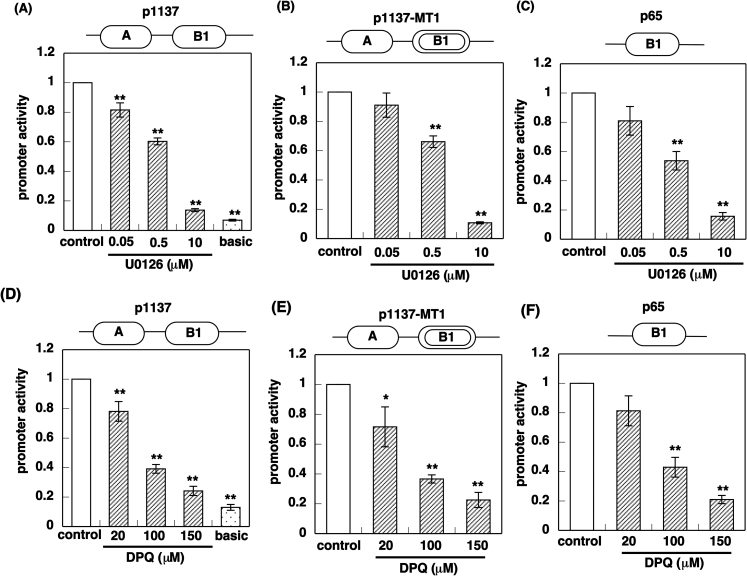
Figure 6. Effect of MEK inhibitor (A–C) and PARP-1 inhibitor (D–F) on H1R promoter activity.
HeLa cells were serum-starved for 24 h and then treated with or without 0.05–10 μM of U0126, a MEK inhibitor (A–C), or 20–150 μM of DPQ, a PARP-1 inhibitor (D–F), 1 h before stimulation with 100 nM of PMA for 10 h. A and B1 represent region A and B1 of the H1R promoter, respectively.  , WT promoter;
  , MT1 promoter. Data are presented as mean ± S.E.M. [n = 4 (A, B, and D), 7 (C and F), or 3 (E)]. **, p < 0.05 vs. control.

