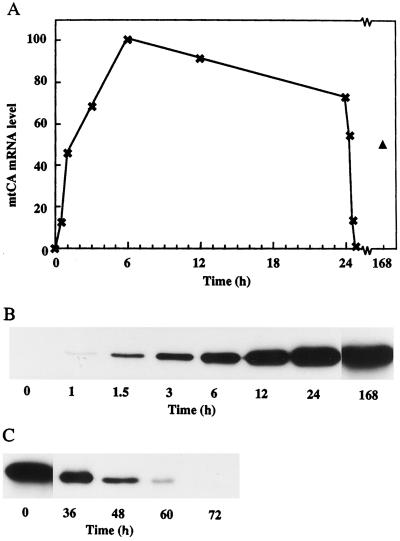
Figure 1.
Time-course experiments of the induction and degradation of mtCA. A, Northern analysis of the relative amounts of the mtCA mRNA. High-CO2-grown cells were transferred to low-CO2 conditions at time 0. After 24 h, the culture was transferred back to high-CO2 conditions. The triangle represents cells left on low CO2 for 1 week. All lanes on the northern blot contained 5 μg of total RNA. B, Western blot of the induction of mtCA. Numbers represent hours after transfer to low CO2. All lanes contained 0.5 μg of protein. C, Western blot of the degradation of mtCA. Numbers represent hours after transfer from low CO2 to high CO2. All lanes contained 0.5 μg of protein.

