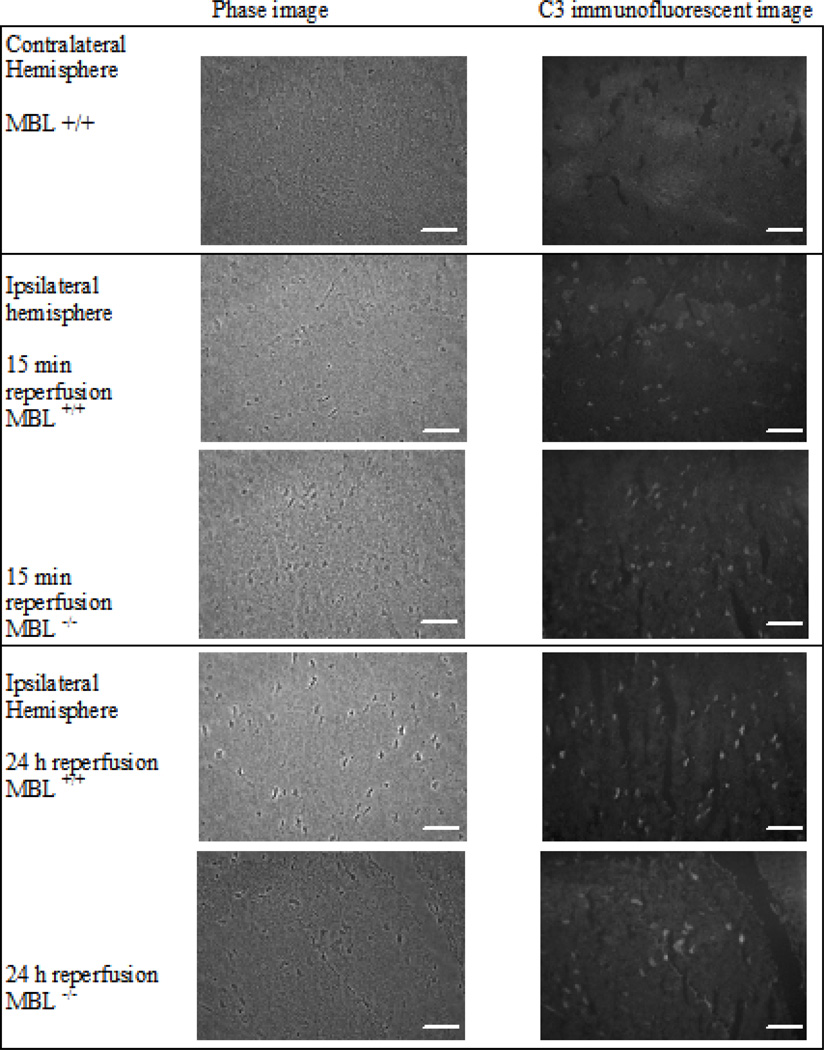
Fig. (6). Histopathological and immunofluorescent evaluation of infarcted brain tissue.
Contralateral (Row 1) and ipsilateral hemispheres were assessed for C3 deposits in four different animal groups: Row 2) ischemia and 15 minutes of reperfusion in MBL+/+ animals (n = 2), Row 3) ischemia and 15 minutes of reperfusion in MBL−/− animals (n = 3), Row 4) ischemia and 24 hours of reperfusion in MBL+/+ animals (n = 2), and Row 5) ischemia and 24 hours of reperfusion in MBL−/− animals (n = 3). Phase images (column 1) and C3-FITC images (column 2) were captured using a 40X magnification. The contralateral hemisphere image is representative for all groups. C3 deposits, marked by the fluorescent C3-conjugated antibody and white spots present in infarcted tissue, were observed in all groups. Scale marker is 50 microns.

