Fig. 3.
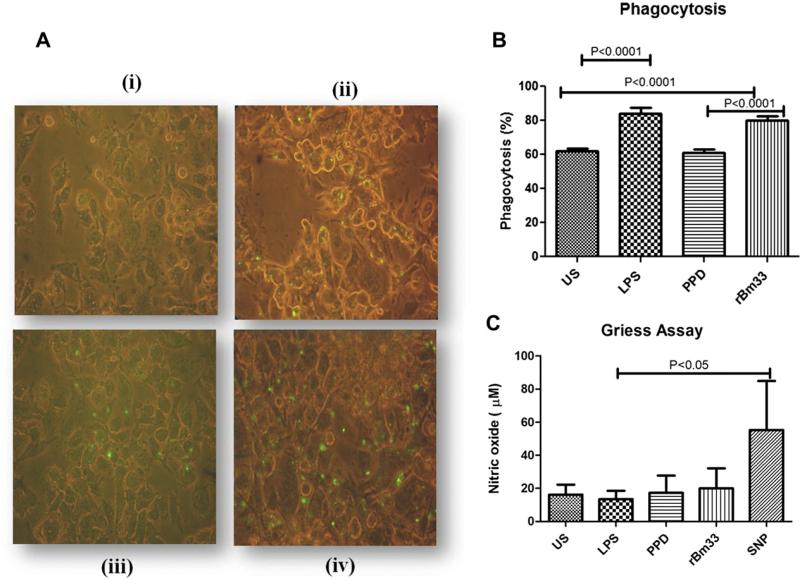
Phagocytosis assay (A) Photomicrograph of one of the representative experiment of five independent experiments of THP-1 monocytic cells differentiated into macrophages by PMA and incubated with stimulants for 24 h. Subsequently green fluorescent protein expressing E. coli was added and incubated for 2 h to examine phagocytosis by fluorescent microscopy represented by green dots. (i)Unstimulated cells (US) X400, (ii) Lipopolysaccharide (LPS,100 ng/ml) X400, (iii) Purified Protein Derivative (PPD, 10 μg/ml) from M. tuberculosis X400, (iv) Recombinant Bm33 (rBm33,10 μg/ml) X400. (B) Percent phagocytosis = (number of bacteria/200 macrophages) × 100 determined from (A), values are mean ± S.D of five independent experiments. (C) Nitric oxide (NO) levels in the culture supernatants of phagocytosis assay. Nitric oxide release was measured in PMA rested THP-1 cells unstimulated cells (US), PMA rested THP-1 cells stimulated with Lipopolysaccharide (LPS, 100 ng/ml), purified protein derivative (PPD, 10 μg/ml) from M. tuberculosis, recombinant Bm33 (rBm33, 10 μg/ml) and sodium nitro prusside (SNP, 300 μM) as positive control and incubated for 24 h and culture supernatants were collected and NO measured by Griess Assay. Values are mean ± S.D of five independent experiments. (For interpretation of the references to color in this figure legend, the reader is referred to the web version of this article.)

