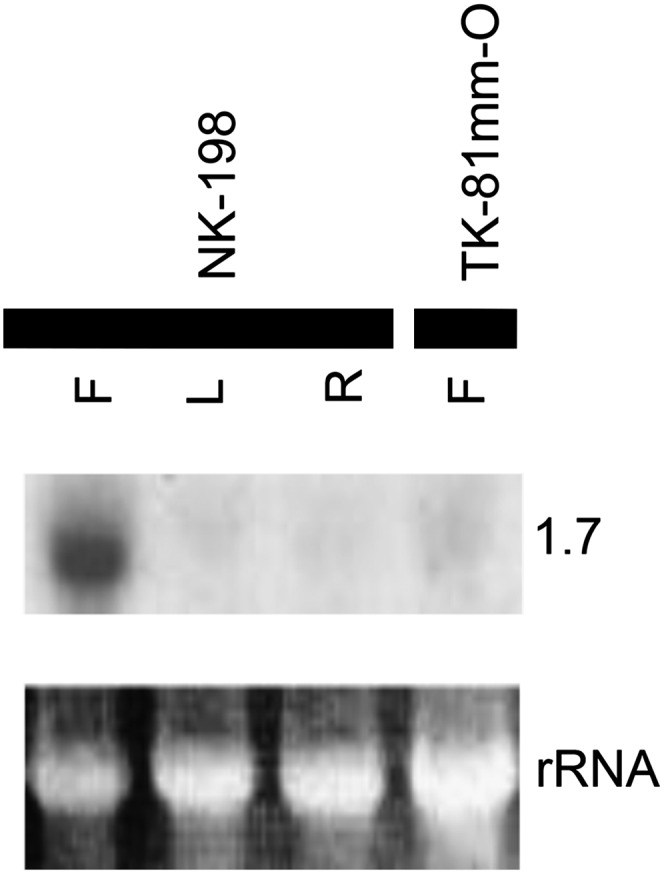
Figure 3 .

RNA gel blot analysis of the 3′-UTR of bvORF19 hybridized with total RNAs from flower buds (F), leaves (L), and roots (R) of NK–198, and from flower buds of TK–81mm–O. Sizes of signal bands are indicated in kilobases. Images in the bottom row show ethidium-bromide (EtBr-) rRNA after gel electrophoresis.
