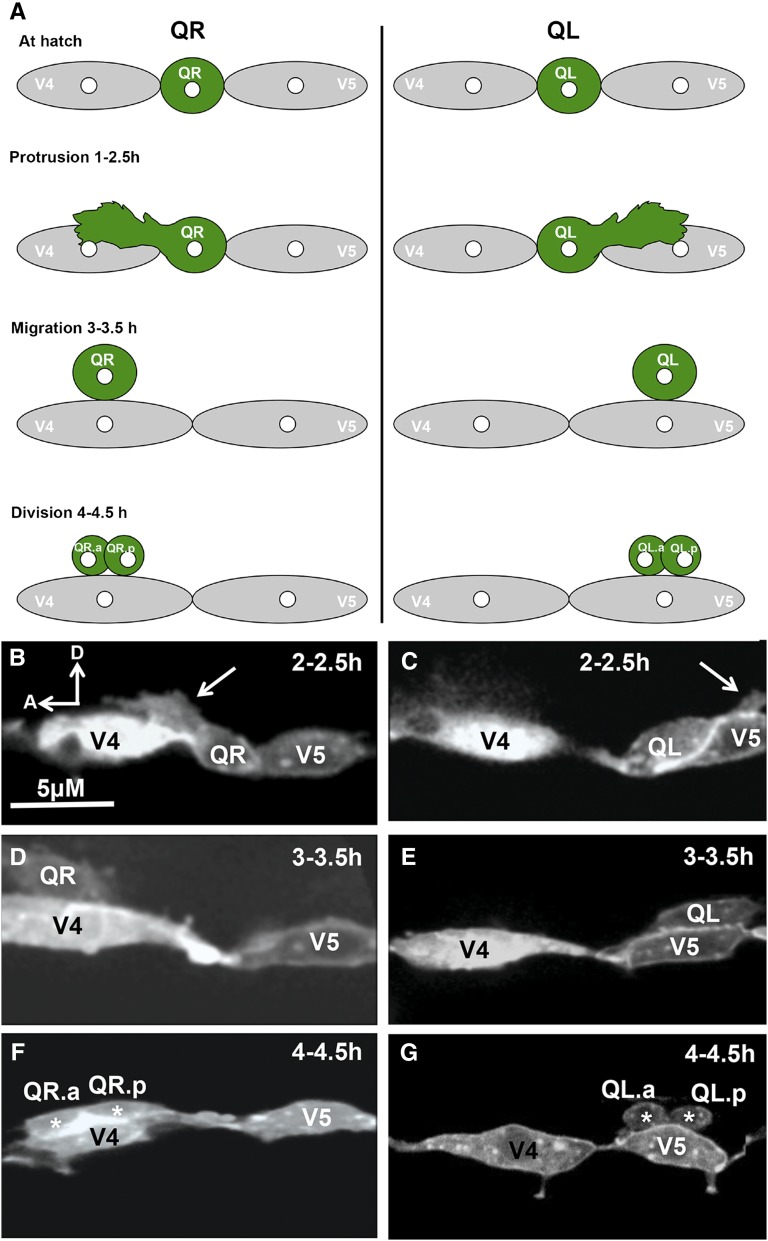
Figure 4 .
Q neuroblast protrusion and migration in wild type. (A) Diagram of Q neuroblast protrusion and migration, with times after hatching indicated. (B–G) Micrographs of wild-type Q neuroblasts and seam cells V4 and V5 are shown at different stages scored (see Materials and Methods). The Pscm::gfp::caax transgene lqIs80 was used to visualize these cells. In all micrographs, anterior is to the left, and dorsal is up. (B and C) At 2–2.5 hr posthatching, QR sent a protrusion anteriorly over V4 and QL posteriorly over V5 (arrows). (D and E) At 3–3.5 hr, QR had migrated atop V4, and QL had migrated atop V5. (F and G) At 4–4.5 hr, QR had divided above V4 and QL atop V5 (daughter cells denoted by asterisks). Bar (in A), 5 μM for each panel.

