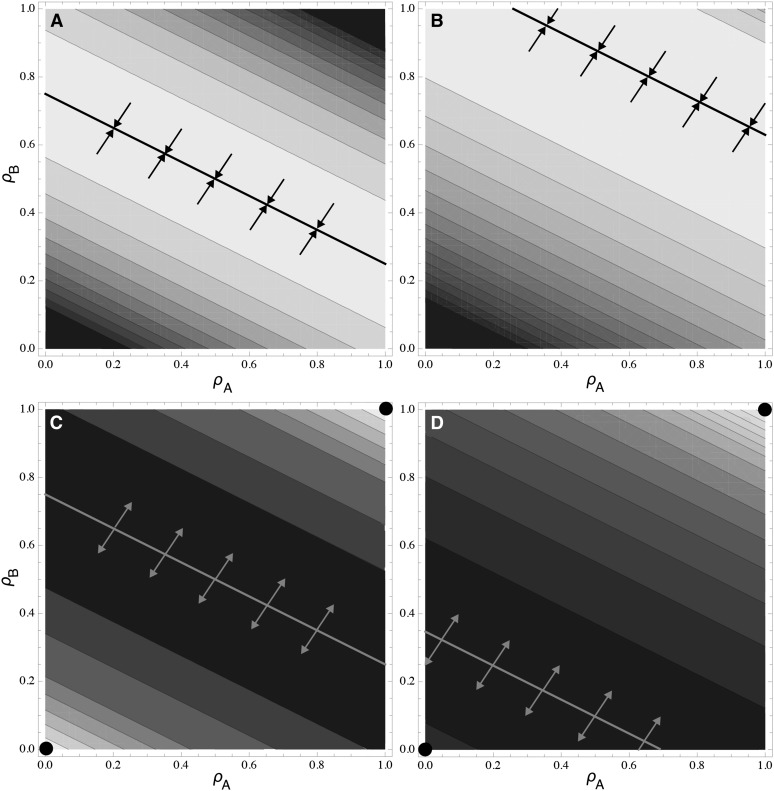
Figure 6 .
Fitness surface and ESS ridges in the two-locus model with competitive allocation (u = 1). Parameters are αA = 1/4, αB = 1/2 with β1 = β2 = 1/2 in A and C and β1 = 0.2, β2 = 0.8 in B and D. Trait fitness is robust (v = 1/2) in A and B and sensitive (v = 2) in C and D. The ridge is presented as a solid line, using Equation A10 when β1 = β2 or determined numerically otherwise. Darker colors represent lower fitness values. The ESS ridge is attracting in A and B and favors the evolution of some degree of pleiotropy at both genes, while specialist strategies are favored in C and D, with both genes specialized on the same trait, denoted by the circles and the arrows pointing away from the ridge.

