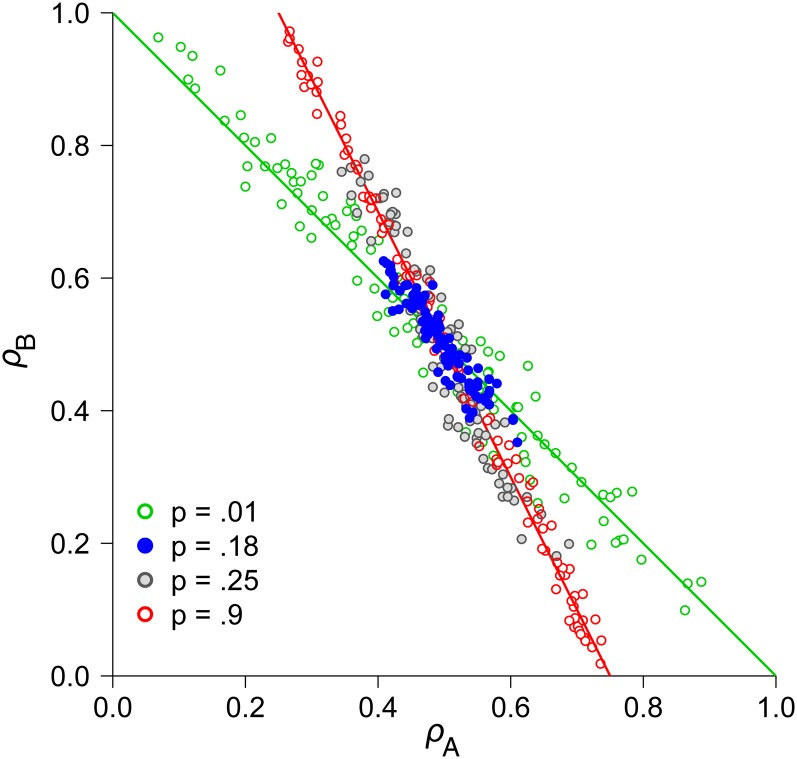
Figure 7 .
Evolution of pleiotropy in two-locus simulations with coarse-grained noise and robust traits. The level of expression at each coding locus is αA = αB = 0.5, with noise reducing gene expression in some individuals by ΔαA = 0.1 and ΔαB = 0.3. The green line is the ESS ridge line in the absence of noise (p = 0) while the red line represents the expectation for expression levels reduced by ΔαA and ΔαB in every individual (p = 1), as given by numerically solving Equation 18. Each point on the graph represents a different simulation, with 100 replicates per parameter set, for various values of p (see inset key). Mutations drive the system inward toward pleiotropy at both genes when there are low to intermediate levels of noise (particularly with p = 0.18). The population size is N = 5000, β1 = β2 = 0.5, u = 1, and v = 0.5.

