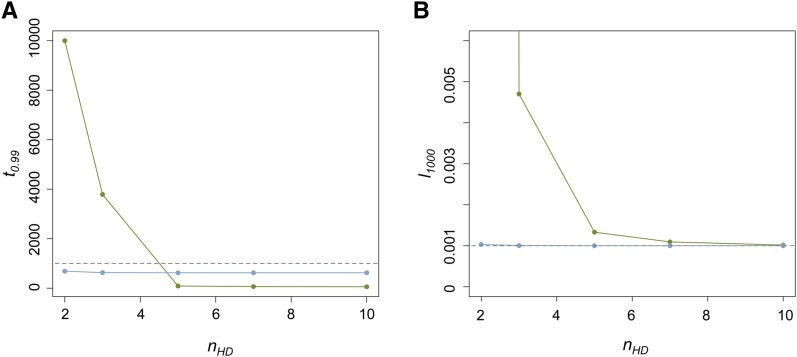
Figure 3 .
The influences of u0 and nHD on the time for near fixation of P elements and host beneficial allele frequency. (A) The generations until the P element is nearly fixed in the population (t0.99) for different u0 and nHD. Green dots are when u0 = 1 and blue dots are when u0 = 10−1. The dashed line denotes generation 1000. (B) The allele frequencies of the host beneficial allele (l1000) at generation 1000 for different u0 and nHD. The dashed line denotes 0.001, which equals l0.

