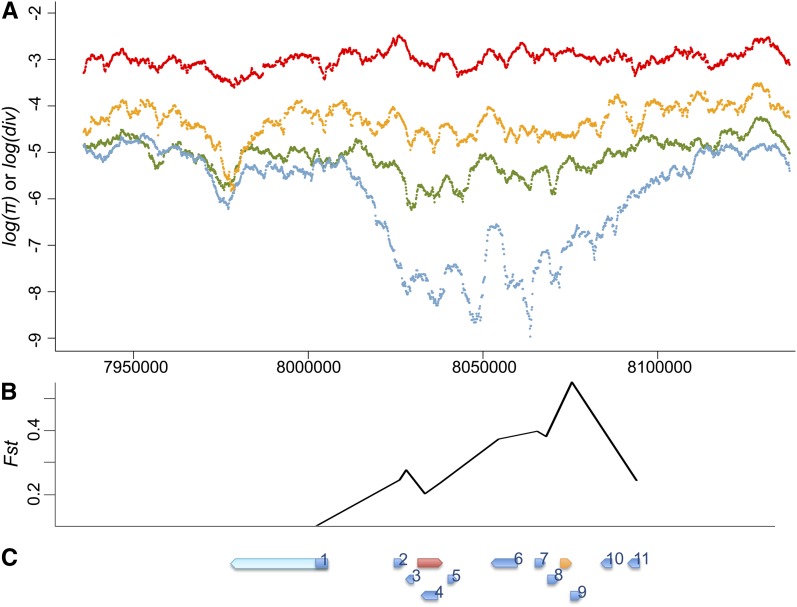
Figure 4 .
Polymorphism, divergence, and temporal differentiation around Hen1. (A) Divergence between D. melanogaster and D. simulans (red), polymorphism of D. simulans (orange), polymorphism of the post–P-element African D. melanogaster population (green), and polymorphism of the post–P-element North American D. melanogaster population (blue) of 100 kb upstream and downstream of Hen1 (from 8,033,215 to 8,040,257) are shown on a log scale. There is a dramatic drop of polymorphism in the North American D. melanogaster populations around Hen1. (B and C) Temporal differentiation between pre–P- and post–P-element North American populations of control genes (B), and their relative position (C). Genes in (C) are Hen1 (red), Cyp6g1 (orange), jeb (1), CG8378 (2), CG13178 (3), CG8878 (4), CG8407 (5), Oda (6), wash (7), CG33964 (8), Cyp6t3 (9), RpS11 (10), and Sr-CII (11). Sequenced regions of each control gene are shown in blue while unsequenced regions are in light blue. The coordinates of three figures are aligned.

