Figure 1 .
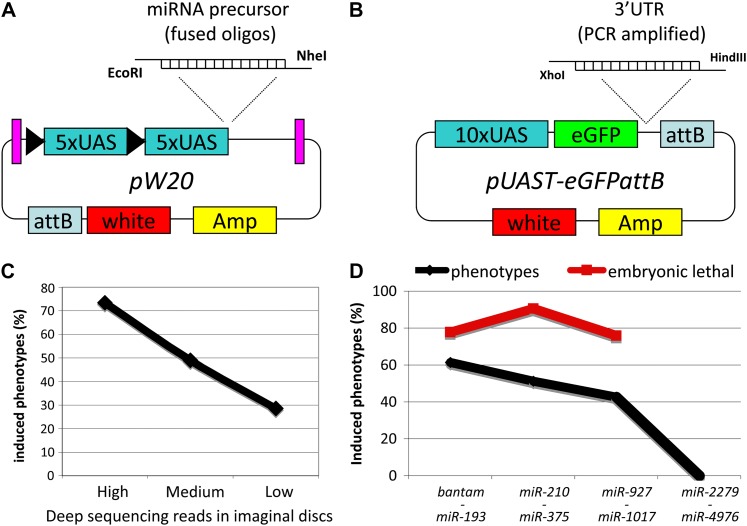
Construction and evaluation of the UAS-miR library. (A) pW20. Purple bars represent gypsy insulator sequences. Black triangles indicate loxP sites. miRNA precursors are directly cloned into EcoRI and NheI sites. The attB integration site, the white marker, and ampicillin resistance are indicated. (B) pUAST-eGFPattB vector and cloning strategy for 3′ UTR constructs. (C) Correlation of miRNA expression to phenotypic effects caused by miRNA expression. We divided the miRNAs into three classes [top, medium, and lowest 49 miRNAs according to reads in deep-sequencing experiments of imaginal discs (Berezikov et al. 2011)]. (D) Distribution of phenotypes over the miRNA spectrum (black line). miRNAs were grouped into four classes according to their evolutionary conservation and abundance. Class I (bantam to miR-193) contains 44, class II (miR-210 to miR-375) 41, class III (miR-927 to miR-1017) 68, and class IV (miR-2279 to miR-4976) 27 miRNAs. The percentage of lethal phenotypes among all phenotypes in each class is indicated by the red line.

