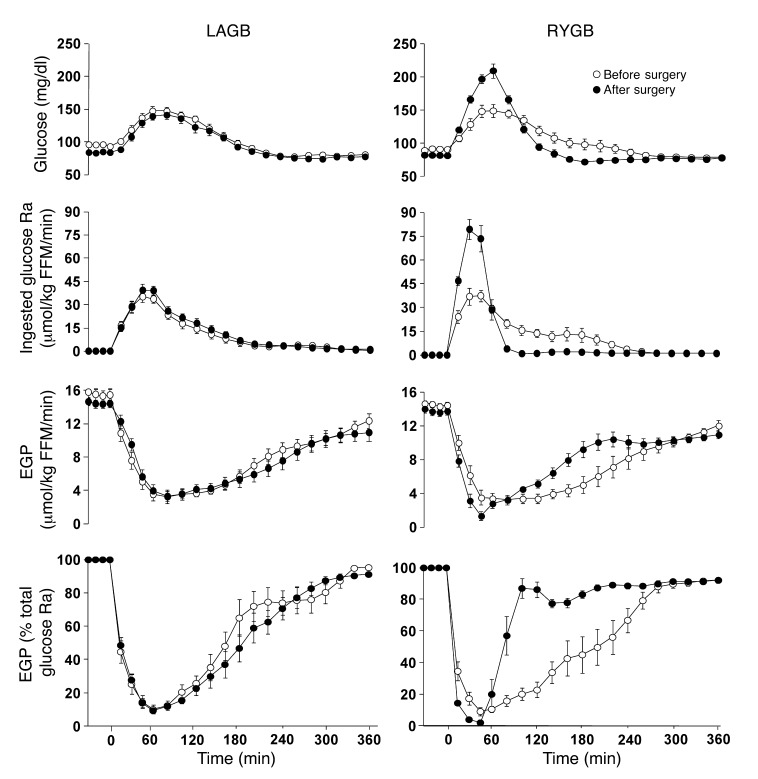
Figure 4. Plasma glucose concentration, ingested glucose Ra into the systemic circulation, EGP rate, and EGP as percentage of total glucose Ra into the systemic circulation after ingestion of a mixed meal (consumed over 30 minutes) before and after 20% weight loss induced by LAGB or RYGB surgery.
Weight loss–induced changes in all parameters shown were significantly different between LAGB and RYGB groups (P < 0.0001). Values are means ± SEM.

