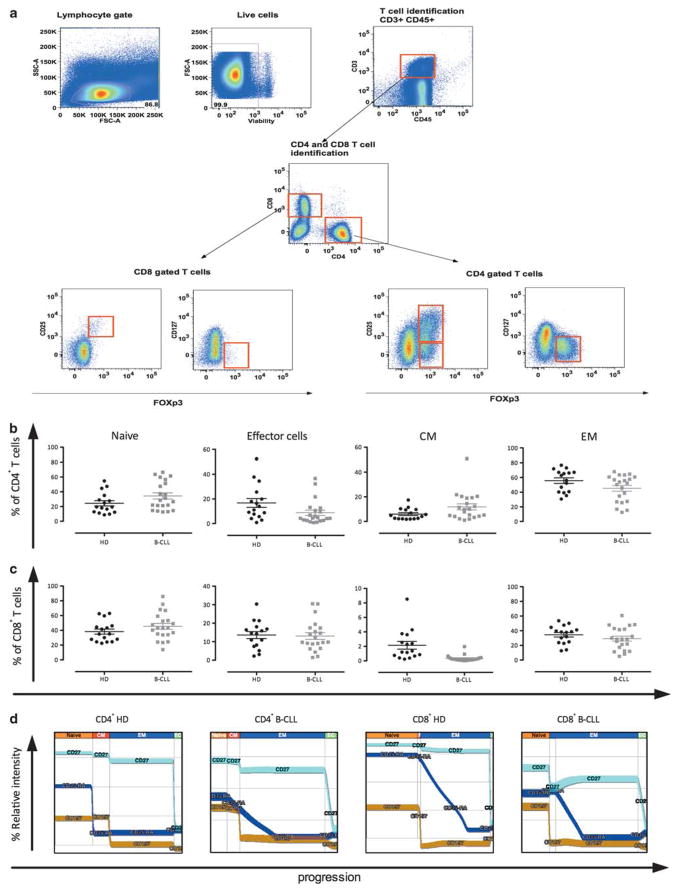
Figure 1.
Gating strategy to identify T regulatory (Tregs) population in chronic lymphocytic leukemia patients and CD4 and CD8 characterization. Single-cell suspensions from chronic lymphocytic leukemia were stained with a combination of 14 antibodies and a viable dye as described in Materials and methods. (a) Lymphocytes were identified based on their forward- and side-scatter properties. Subsequently, dead cells were excluded through the use of a viability dye. CD45 and CD3 were used to identify T cells (CD45+CD3+) among the previously selected viable lymphocytes. CD4 T cells and CD8 T cells were identified as uniquely expressing CD4 or CD8 antigens. Conventional Tregs were defined as CD4 T cells co-expressing CD25 and transcription factor forkhead box P3 (FOXP3). CD127 expression was measured in FOXP3-expressing cells. CD25− Tregs were defined as CD4+FOXP3+CD25− T cells. CD8 Tregs were defined as CD8+CD25+FOXP3+ T cells. In addition to Tregs memory and naïve compartment of CD4 and CD8 was described. The graphs display the percentages (the mean percentage values±s.e.m. are indicated by the bars) of naïve vs memory sub-population CD4 Tcells (b) and CD8 T cells (c) in healthy donors (black circle) and chronic lymphocytic leukemia (gray square). (d) A probability state model constructed with GemStone (Verity Software House) was applied to CD4 T cells and CD8 T cells from healthy donors and from chronic lymphocytic leukemia. For these displays, the data were gated on light scatter, viability, and expression of CD45, CD3, and either CD4 or CD8 as described earlier. The y-axis is relative fluorescence intensity, whereas the x-axis displays staged progression from naïve to memory (CM, EM) and effector (EC) compartments. The width of each stage (naïve, EM, CM, EC) indicates the percentage of cells falling into these categories. The width of the bands corresponds to the variability of the data as the cells progress. These graphs reveal the same proportions of memory and naïve subsets as in the previous figures, although here it is possible to visualize relative intensity of marker expression along with putative transitions among these populations.

