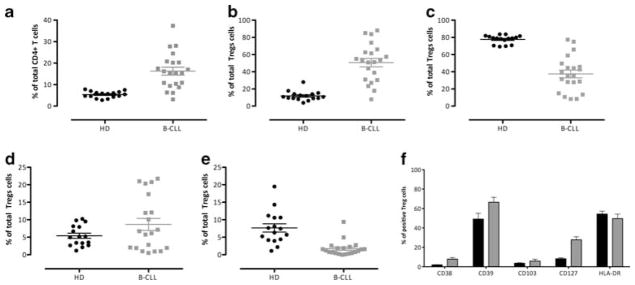
Figure 2.
Conventional Tregulatory (Tregs), memory vs naïve subtypes and expression of activation markers in healthy donors and chronic lymphocytic leukemia. Cells were stained as described in Materials and methods and analysis was performed to identify conventional Tregs. (a) Percentages and the mean percentage values (±s.e.m.) of CD4 Tregs in healthy donors (black) and chronic lymphocytic leukemia (gray). (b) Percentages and the mean percentage values (±s.e.m.) of naïve Tregs in healthy donors (black) and chronic lymphocytic leukemia (gray) identified as CD45RA+ cells among Tregs. (c) Percentages and the mean percentage values (±s.e.m.) of effector memory (EM) Tregs identified as CD27+CCR7− cells among Tregs in healthy donors (black) and chronic lymphocytic leukemia (gray). (d) Percentages and the mean percentage values (±s.e.m.) of central memory (CM) Tregs identified as CD27+CCR7+ cells among Tregs in healthy donors (black) and chronic lymphocytic leukemia (gray). (e) Percentages and the mean percentage values (±s.e.m.) of effector Tregs identified as CD27−CCR7− cells among Tregs in healthy donors (black) and chronic lymphocytic leukemia (gray). (f) Percentages and the mean percentage values (±s.e.m.) of Tregs expressing activation markers CD38, CD39, CD103, CD127, and HLA-DR were measured in healthy donors (black) and chronic lymphocytic leukemia (gray).

