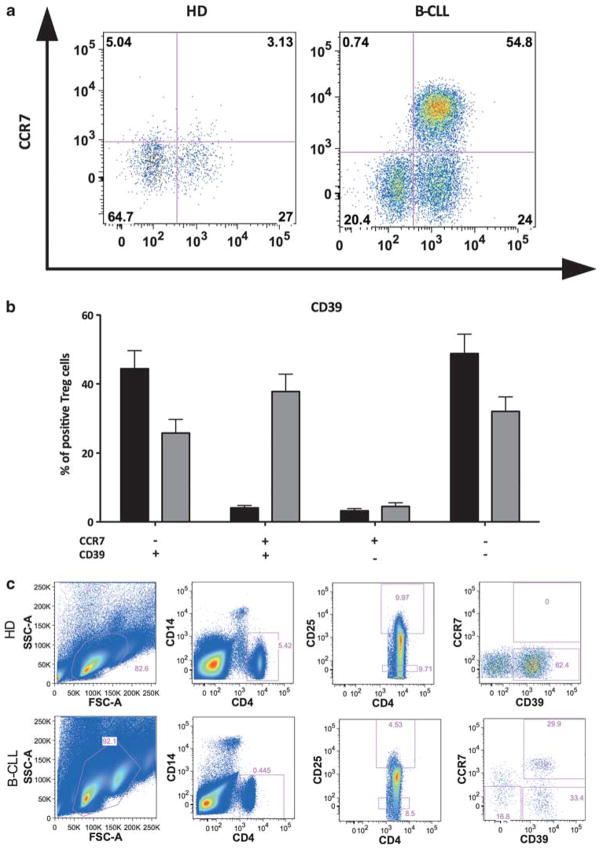
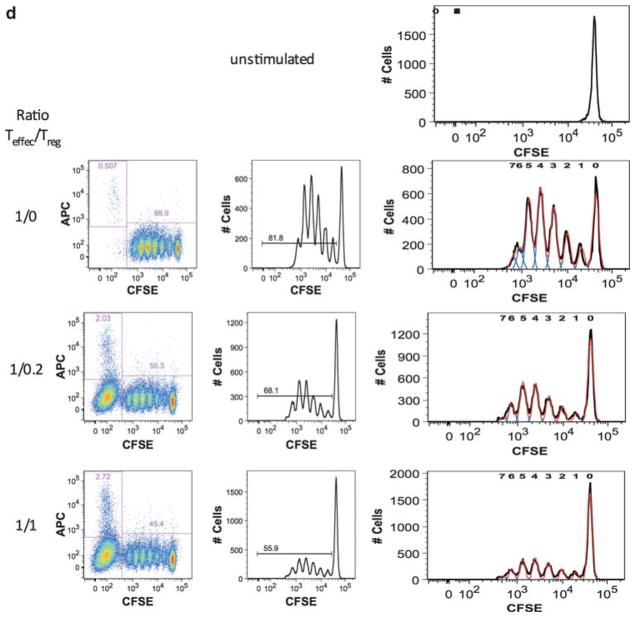
Figure 3.
Co-expression of CD39 and CCR7 in conventional T regulatory (Tregs) in healthy donors and chronic lymphocytic leukemia and autologous Treg-mediated suppression of polyclonal T-cell responses from healthy donors and chronic lymphocytic leukemia. Conventional Tregs were identified after staining as described earlier. Expression of the activation markers CD39 and CCR7 were measured. (a) Representative dot plot of CD39 and CCR7 co-expression pattern on conventional Tregs in a healthy donor (left panel) and chronic lymphocytic leukemia (right panel). (b) Histograms of the mean percentages (±s.e.m.) of Tregs expressing these markers in healthy donors (black) and chronic lymphocytic leukemia (gray). (c) Tregs were isolated using flow cytometric sorting as described earlier. Expression of CD25 and CD4 were used to identify Treg cells in both healthy donors and in chronic lymphocytic leukemia. A representative dot plot of CD39 and CCR7 expression pattern in a healthy donor (upper panel) and chronic lymphocytic leukemia (lower panel). (d) Suppressive capacity of Tregs toward responder cells (Teffec) was expressed as relative inhibition of the percentage of CSFE-low cells.


