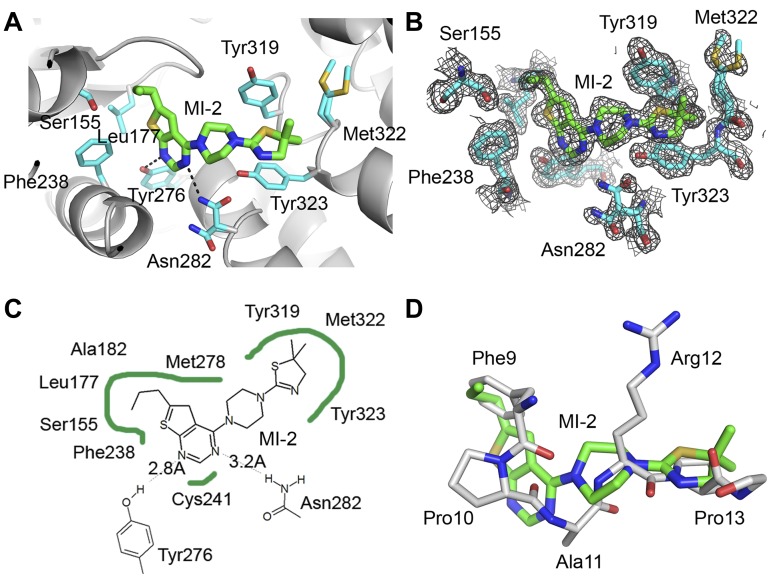
Figure 2.
Crystal structure of the menin–MI-2 complex. (A) Details of MI-2 interaction with menin. Selected menin side chains are shown in sticks (cyan carbons) and hydrogen bonds are shown as dashed lines. (B) Menin-MI-2 complex determined at 1.56 Å resolution with corresponding 2Fo-Fc electron density map contoured at the 1σ level. (C) Diagram depicting VdW contacts and hydrogen bonds (dashed lines) between MI-2 and menin. (D) Superposition of MI-2 (green carbons) with a fragment of the MBM1 motif (MLL residues 9-13, gray carbons) in a menin-bound conformation.

