
Figure 2.
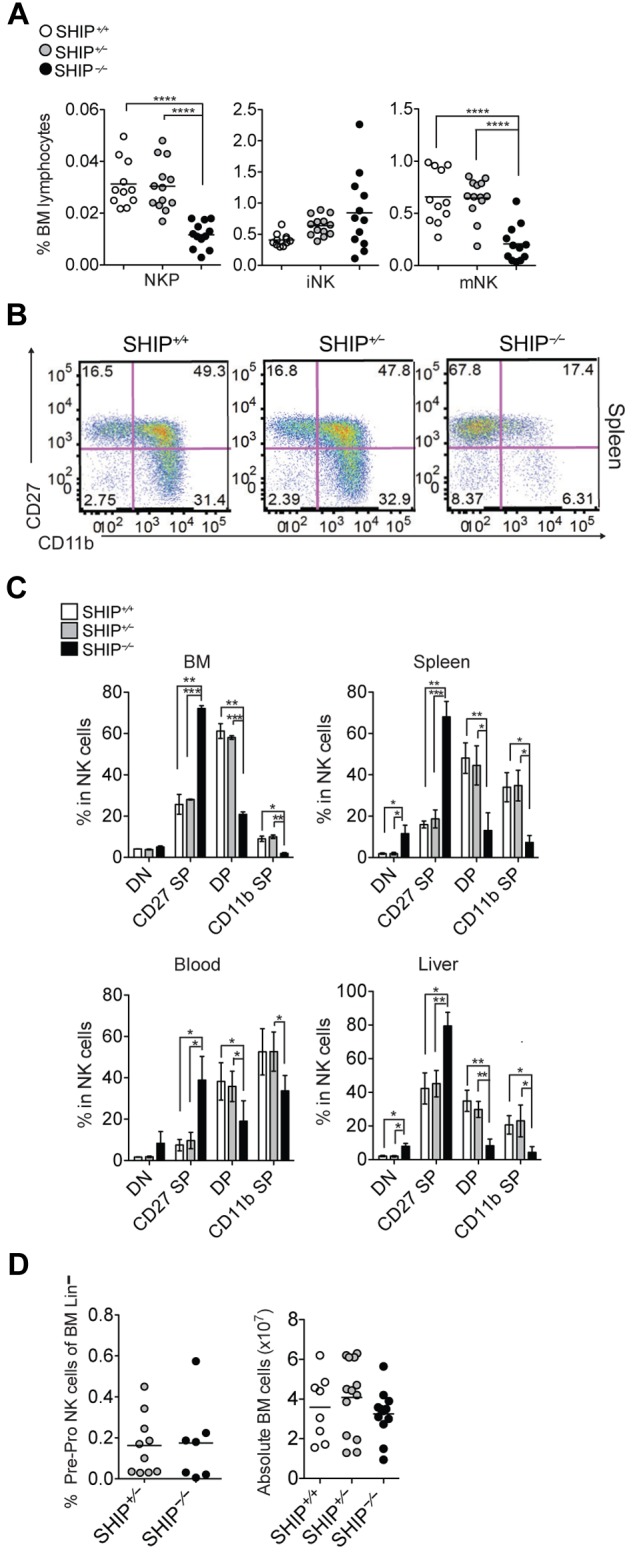
Impaired NK cell development in BM and periphery of SHIP−/− mice. (A) Percentages of NKPs (CD122+NK1.1−CD3−CD11b−), iNK cells (CD122+NK1.1+CD3−CD11b−), and mNK cells (CD122+NK1.1+CD3−CD11b+) among bone marrow lymphocytes derived from littermate SHIP+/+ (white circles), SHIP+/− (gray circles), and SHIP−/− (black circles) mice. Data are pooled from at least 5 independent experiments, and each dot represents data obtained from one mouse; horizontal lines indicate the mean. (B) Representative staining in NK cells (NK1.1+CD3−) expressing DN (CD27−CD11b−), CD27 SP (CD11b−CD27+), DP (CD27+CD11b+), and CD11b SP (CD27−CD11b+) populations in spleens from SHIP+/+, SHIP+/−, and SHIP−/− mice. (C) Percentages in NK cells (NK1.1+CD3−) being DN, CD27 SP, DP, and CD11b SP populations in the indicated organs. Data are representative of at least 8 independent experiments. Data represents means ± SD. (D left panel) Frequency of bone marrow PrePro NK cells (Lineage−, Sca-1+, CD117−, CD135−, CD127+). Data are pooled from 3 independent experiments. (Right panel) Total number of bone marrow cells.