
Figure 2.
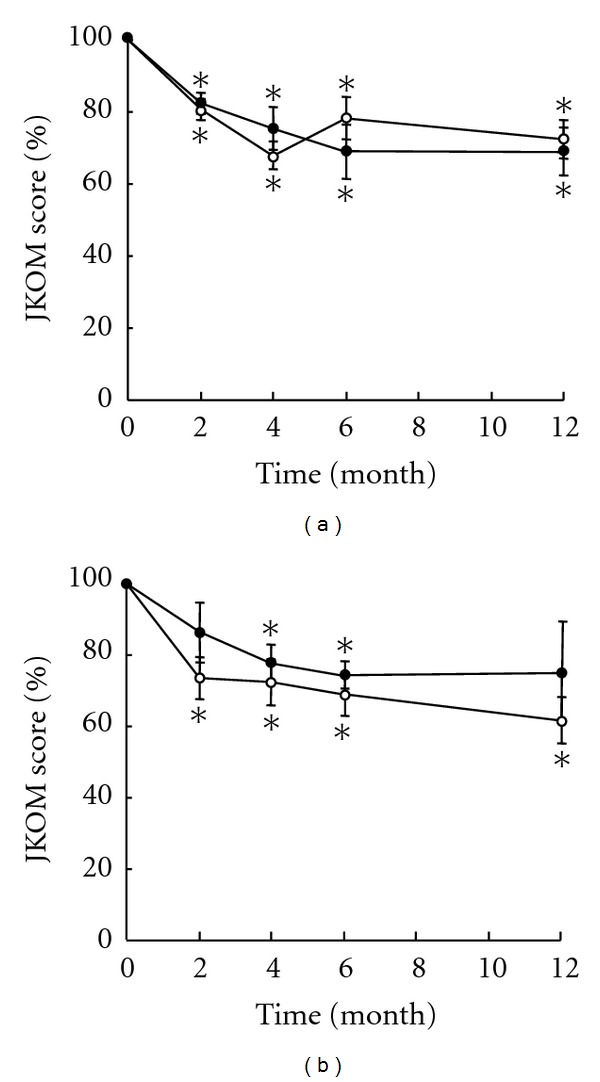
Change in JKOM score with respect to disease severity. Subjects were divided by the Kellgrel-Lawrence (K/L) grade determined on radiographs, and changes in the total JKOM score are shown in respective groups by change rates relative to scores at baseline. Results of subjects with K/L grade 2 knee OA (A) and those with K/L grade 3 OA (B) are shown. Open and closed circles indicate change rates of subjects given HA and placebo, respectively. Results are mean ± SE of 9 to 11 subjects. *P < 0.05 against baseline.