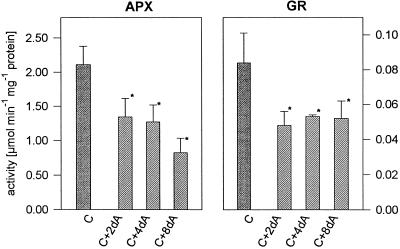
Figure 3.
Activity of APX and GR after 2, 4, and 8 d of anoxia (C+2dA, C+4dA, and C+8dA, respectively) compared with aerated controls (C). Each data point represents the mean of three or 10 (for control) separate experiments. Bars, ± sd; asterisks, the significance of differences at 5% level between control and anoxically grown plants.

