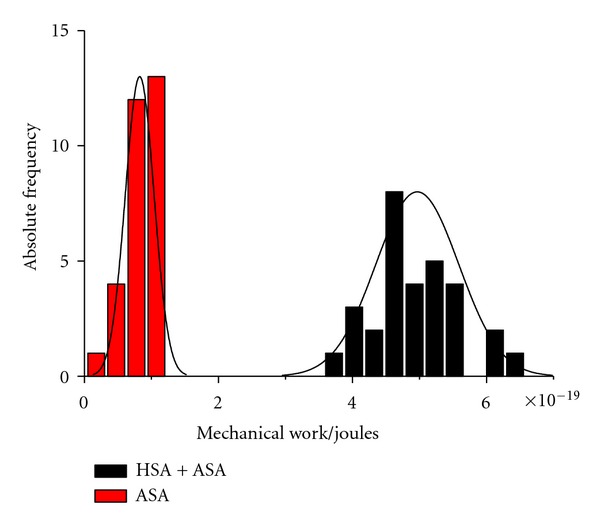
Figure 3.

Histogram representation of the mechanical work, both for the system in presence (black bars) and absence (red bars) of the HSA complex. The continuous lines are the Gaussian distributions for the corresponding values of standard deviation and mean value for each histogram population.
