Figure 2.
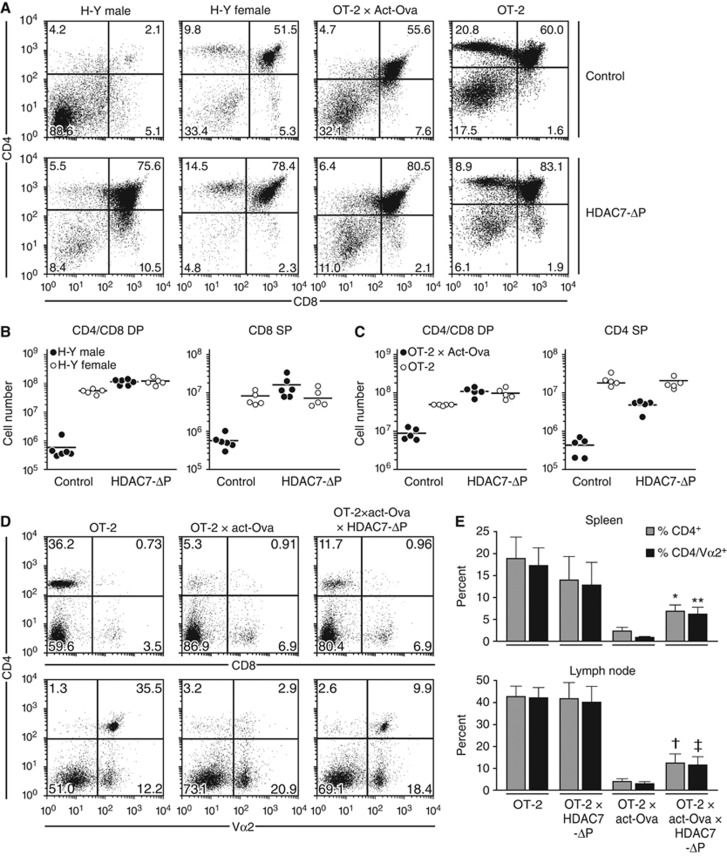
HDAC7-ΔP expression blocks negative thymic selection and permits escape of autoreactive T cells to the periphery. (A) Representative scatter plots showing CD4 and CD8 expression in male and female H-Y TCR transgenic mice (columns 1 and 2), as well as OT-2 X Act-Ova and OT-2 transgenic mice (columns 3 and 4) in the absence (top row) or presence (bottom row) of the HDAC7-ΔP transgene. (B) Quantification of CD4/CD8 DP (left) and CD8 SP (right) thymocytes in littermate male H-Y TCR and H-Y TCR X HDAC7-ΔP TG mice (filled circles), as well as the corresponding female mice (open circles). Results for five or six littermate pairs of control/HDAC7-ΔP TG mice are shown. P-values for WT-HDAC7-ΔP comparisons (two-tailed T-test) are as follows: male DP: 4.8 × 10⁻⁷; female DP: 0.0023, male CD8 SP: 0.0032; female CD8 SP: 0.77. (C) Quantification of CD4/CD8 DP (left) and CD4 SP (right) thymocytes in OT-2 X act-Ova and OT-2 X act-Ova X HDAC7-ΔP TG mice (filled circles), as well as OT-2 and OT-2 X HDAC7-ΔP TG mice (open circles). Results are shown for five littermate pairs. P-values for WT-HDAC7-ΔP comparisons (two-tailed T-test) are as follows: OT2 X Act-Ova DP: 5.5 × 10⁻⁵; OT-2 DP: 0.0038, OT2 X Act-Ova CD4 SP: 5.7 × 10⁻⁴; OT2 CD4 SP: 0.51. (D) Representative scatter plots showing expression of CD4 versus CD8 (top) or CD4 versus Vα2 (bottom) in lymph nodes of OT-2 (left), OT-2 X Act-Ova (middle), and OT-2 X ACT-Ova X HDAC7-ΔP (right) mice. (E) Percent CD4+ (dark grey) and Va2+ (light grey) cells in spleen (top) and lymph node (bottom) of OT-2, OT-2 X HDAC7-ΔP, OT-2 X act-Ova, and OT-2 X HDAC7-ΔP X act-Ova mice. P-values for wt-HDAC7-ΔP comparisons (two-tailed T-test) are as follows: *0.00096; **0.0004; †0.0044; ‡0.003.

