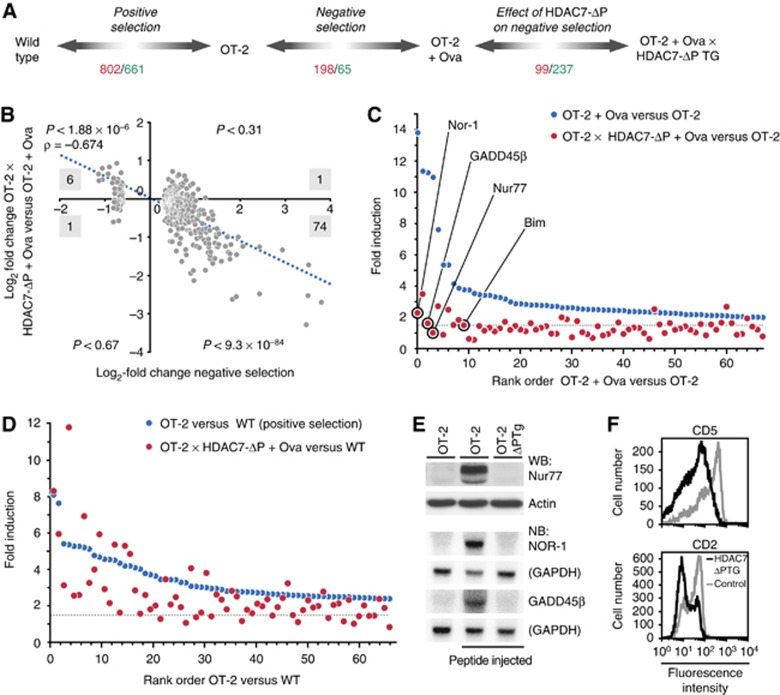
Figure 3.
HDAC7-ΔP blocks some gene expression changes associated with positive selection and most gene expression changes associated with negative selection. (A) Diagram depicting DP thymocyte populations used for gene expression profiling and comparisons made to model positive selection, negative selection, and the effect of HDAC7-ΔP expression on gene expression during these processes. Numbers indicate how many genes were found to be significantly upregulated (red) and downregulated (green), based on a SAM delta score of ⩾1.85 and a mean fold differential expression ⩾1.5 for three biological replicates of each condition. (B) Scatter plot, with trend line and correlation coefficient indicated, showing gene expression changes during negative selection (OT-2+Ova versus OT-2, horizontal axis) versus the corresponding differences between stimulated OT-2 and OT-2 X HDAC7-ΔP thymocytes (vertical axis). Results are shown for 263 genes found to be differentially expressed during negative selection, based on three littermate pairs of OT-2 and OT-2 X HDAC7-ΔP ova-injected mice. Black numbers indicate how many genes in each quadrant are differentially expressed for both comparisons. P-values shown for each quadrant are according to the binomial distribution for the number of overlapping genes indicated. (C) Graph showing fold upregulation of 67 genes upregulated two-fold or more in OT-2 DP thymocytes 2.5 h after agonist peptide injection versus unstimulated OT-2 thymocytes (blue symbols). Corresponding fold induction values are shown in red for OT-2 X HDAC7-ΔP TG DP thymocytes versus unstimulated OT-2 thymocytes. Dashed line indicates 1.5-fold threshold for significant induction. (D) Graph showing fold upregulation of top 67 genes induced during positive selection (OT-2 versus WT, blue symbols). Corresponding values are shown in red for Ova-stimulated OT-2 X HDAC7-ΔP TG DP thymocytes versus wild-type thymocytes. Dashed line indicates 1.5-fold threshold for significant induction. (E) Expression of Nur-77 (assayed by western blot), Nor-1, and GADD45β (assayed by northern blot) in OT-2 thymocytes (left), OT-2 thymocytes 2.5 h after antigenic peptide injection (middle), and OT-2 X HDAC7-ΔP TG thymocytes 2.5 h after antigenic peptide injection (right). (F) Expression of CD5 (top) and CD2 (bottom) in OT-2 (grey histograms) and OT-2 X HDAC7-ΔP TG (black histograms) DP thymocytes. Figure source data can be found with the Supplementary data.

