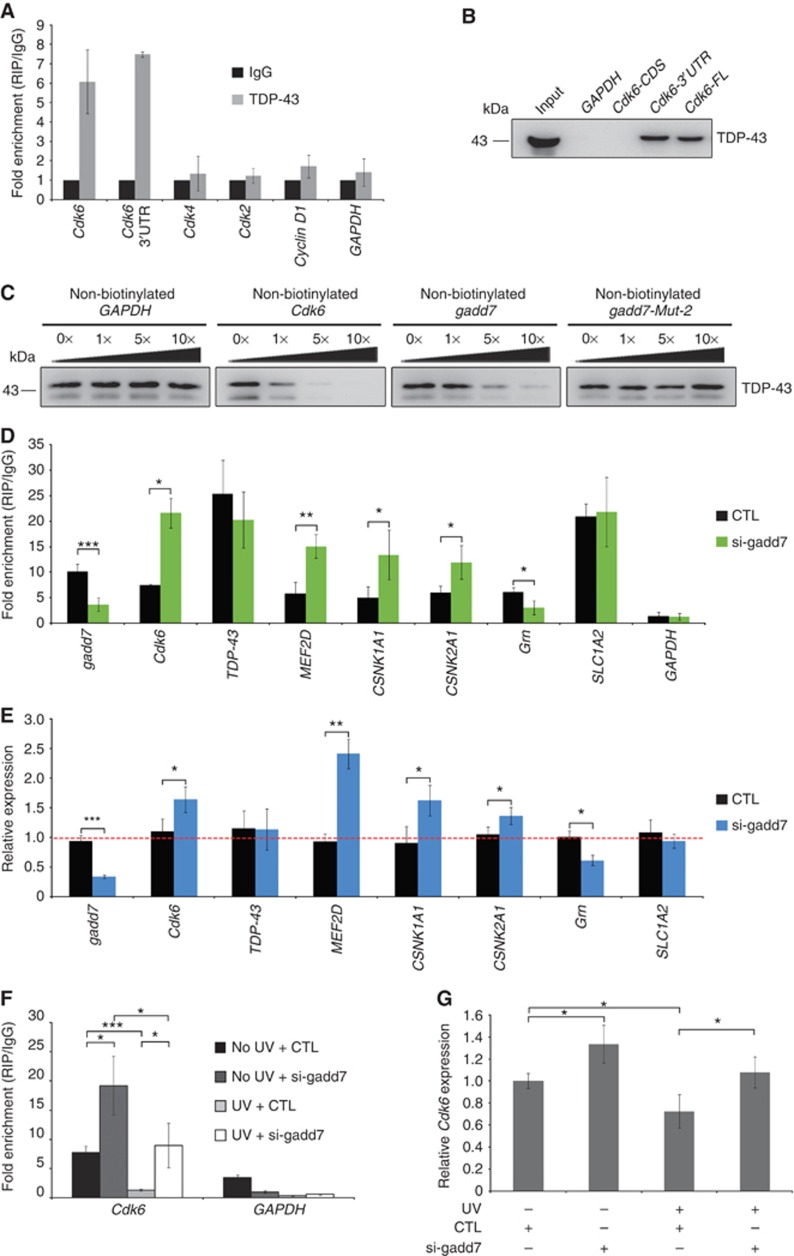
Figure 6.
gadd7 abrogates the interaction between TDP-43 and Cdk6 mRNA. (A) TDP-43 binds to Cdk6 mRNA in vivo. RIP with TDP-43 antibody was performed using CHO-K1 lysates and subsequently subjected to qRT–PCR analysis for the indicated RNAs. IP enrichment is determined as the amount of RNA associated to TDP-43 IP relative to IgG control. Data are from one of three independent experiments and are represented as mean±s.d. with n=3. (B) Cdk6 3′UTR is responsible for its binding to TDP-43. RNA pull-down assay was performed with different regions of Cdk6 mRNA. FL, full length. (C) Competition assay analysis of the binding of TDP-43 to Cdk6 mRNA in the presence of various amounts of unlabelled GAPDH (first panel), Cdk6 (second panel), gadd7 (third panel) or gadd7-Mut-2 (fourth panel). (D) The binding of TDP-43 to its 3′UTR targets is affected by gadd7 loss. CHO-K1 cells transfected with control siRNA (CTL) or siRNA pool targeting gadd7 for 48 h were harvested for RIP assay with TDP-43 antibody and IgG. Binding of TDP-43 to the indicated RNA targets was determined by qRT–PCR with primers against their 3′UTRs. IP enrichment is determined as the amount of RNA associated to TDP-43 IP relative to the corresponding IgG control. Data are represented as mean±s.d. from three independent experiments. *P<0.05, **P<0.01, ***P<0.001. (E) The expression of indicated RNA targets as in (D) is changed upon gadd7 depletion as analysed by qRT–PCR. Data are from one of three independent experiments and are represented as mean±s.d. with n=3. *P<0.05, **P<0.01, ***P<0.001. (F) RIP analysis of the interaction between TDP-43 and Cdk6 mRNA upon treatment with control siRNA or siRNA pool targeting gadd7 in the presence or absence of UV irradiation (40 J/m2). Binding of TDP-43 to Cdk6 mRNA was determined by qRT–PCR. IP enrichment is determined as the amount of RNA associated to TDP-43 IP relative to the corresponding IgG control. Data are represented as mean±s.d. from three independent experiments. *P<0.05, ***P<0.001. (G) qRT–PCR quantification of Cdk6 mRNA expression in CHO-K1 cells as treated in (F). Data are from one of three independent experiments and are represented as mean±s.d. with n=3. *P<0.05. Figure source data can be found with the Supplementary data.

