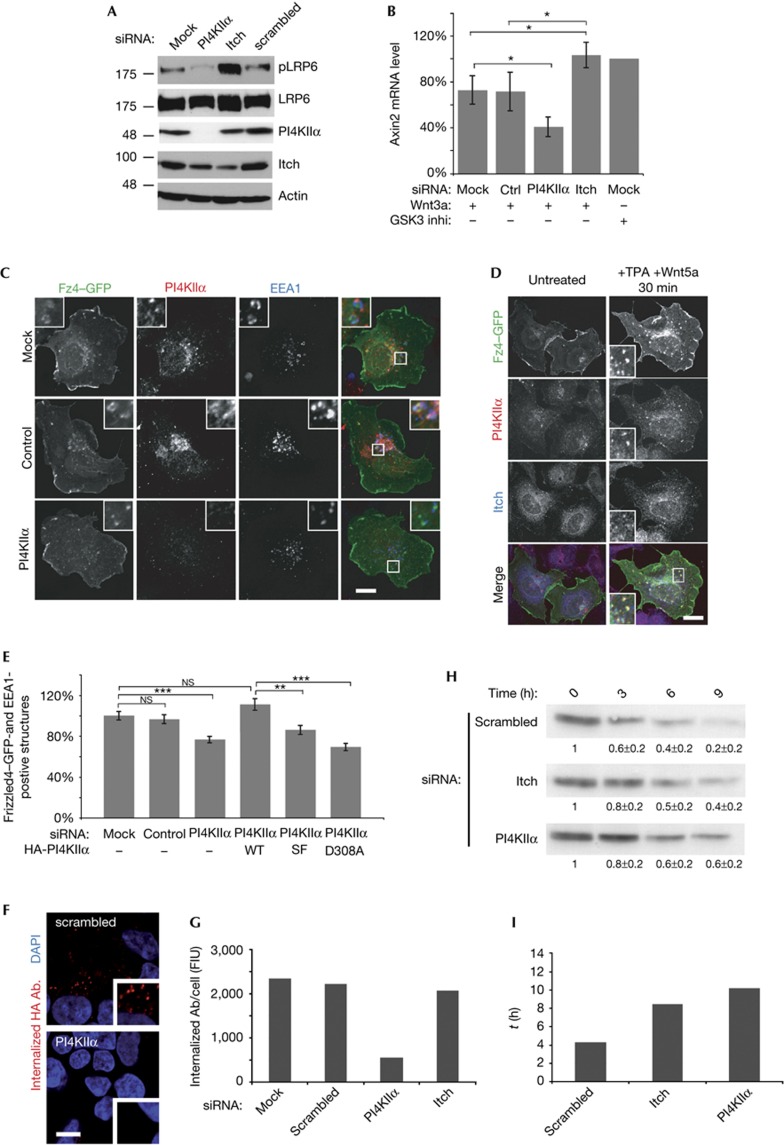
Figure 4.
PI4KIIα/Itch regulate endocytic traffic of Wnt-activated Fz and Wnt target gene expression. (A) Immunoblot of siRNA-treated Cos7 cells labelled for phosphorylated-LRP6 (pLRP6), LRP6, Itch, PI4KIIα and actin (loading control). (B) Axin 2 messenger RNA levels analysed by quantitative reverse transcriptase PCR in Wnt3a-stimulated cells transfected with indicated siRNAs. Axin 2 levels of Wnt3a-treated cells were normalized to mock-transfected cells treated with GSK3 inhibitor. (n=6), *P<0.05. (C) Confocal images of Wnt5a/TPA-stimulated HEK293 cells expressing Fz4–eGFP transfected with the indicated siRNAs or mock-transfected. Cells were stained for EEA1 and PI4KIIα. Scale bar, 12 μm. (D) Confocal images of Wnt5a/TPA-stimulated HEK293 cells expressing eGFP–Fz4, stained for endogenous PI4KIIα and Itch. Scale bar, 12 μm. (E) Quantitative analysis of Fz4–eGFP accumulation in EEA1-positive endosomes as shown in C (mean±s.e.m.; n=3). **P<0.001 and ***P<0.0001. (F) HEK293 cells stably expressing luminally HA-tagged Fz4, were silenced with indicated oligos and allowed to internalize anti-HA antibody for 15 min. Scale bar, 10 μm. (G) Quantification of E (mean from two independent experiments). (H) Degradation of HA–Fz4 in stably transfected HEK293 cells, silenced with the indicated siRNAs. Receptor levels at 0, 3, 6 and 9 h were analysed by immunoblotting for HA (values obtained by densitometry displayed in small inset). (I) τ values for degradation of HA–Fz4 determined from single exponential fits derived from the data exemplified in H (mean from two independent experiments). Both PI4KIIα- and Itch-depleted cells show slowed Fz4 degradation kinetics. DAPI, 4,6-diamidino-2-phenylindole; GFP, green fluorescent protein; HA, haemagglutinin; PI4KIIα, phosphatidylinositol 4-kinase type IIα; siRNA, short interfering RNA; TPA, 12-O-tetradecanoylphorbol-13-acetate.

