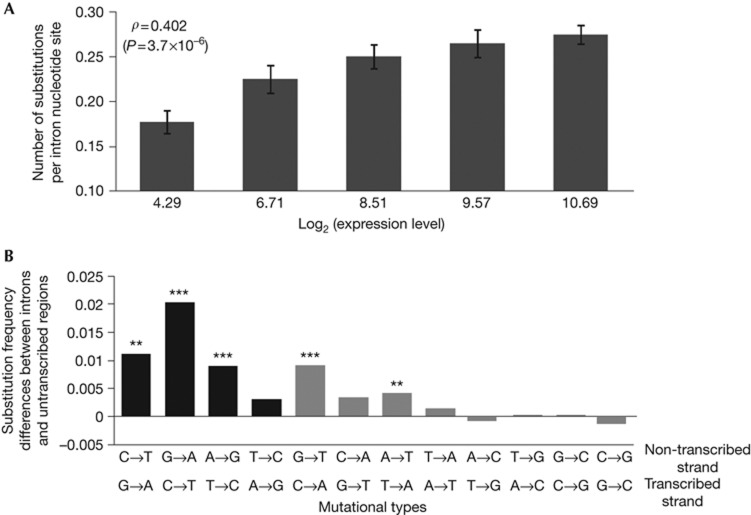
Figure 2.
Nucleotide substitution rates and patterns in yeast introns, on the basis of the comparison between Saccharomyces cerevisiae and S. paradoxus. (A) Substitution rate increases with expression level. Introns are grouped into five equal-size bins on the basis of expression levels, and the mean expression level and mean substitution rate of each bin are presented. Here, the expression level of an intron is determined by the median number of RNA sequencing reads in a 30-bp window located immediately upstream of the 3′ end of the annotated stop codon of the gene [18]. Error bars show one s.e. The rank correlation (ρ) indicated is for the raw unbinned data. (B) Difference in substitution frequency between introns and untranscribed regions for each of the 12 mutation types. Black and grey bars indicate transitions and transversions, respectively. Significance differences from 0 are indicated by *P<0.05, **P<0.01 or ***P<0.001 on the basis of two-tail Fisher’s exact test.

