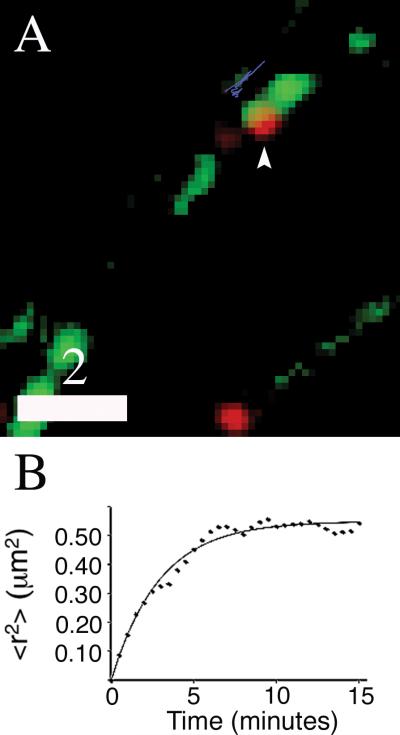
Fig. 5.
DCGs remain localized at presynaptic sites for a few hours. Two-color image (A) of 17-DIV hippocampal neurons expressing BDNF-mCherry (red) and synaptophysin-EGFP (green). A DCG that colocalized with an SV cluster for at least 90 minutes is identified with an arrowhead, and the trajectory of the DCG for a 15-minute time window is shown in blue, slightly offset from the SV cluster. Plot of <r2> versus t (B) obtained from tracking the DCG in panel A for 15 minutes. The line in panel B is a fit to the corralled diffusion model. Scale bar = 2.0 μm. Supplemental Movie 1. Visualization of DCG transport in the soma, along processes, and in boutons of mature neurons. Deblurred time-lapse movie showing transport of DCGs in a 17-DIV hippocampal neuron expressing synaptophysin-EGFP (green) and BDNF-mCherry (red).

