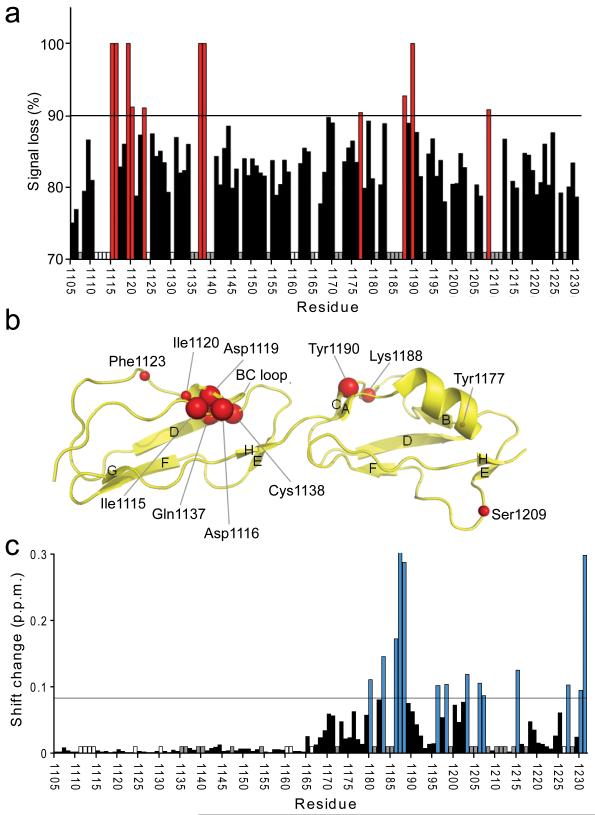
Figure 3.
Heteronuclear NMR spectroscopy used to map the C3d and dp8 binding sites on FH19–20. (a) The percentage broadening observed for unequivocally assigned backbone amides upon addition of C3d is indicated: Red bars signify > 90% broadening; white bars indicate proline residues; and grey bars indicate residues whose assignments were missing or whose intensities were weak in free FH19–20. (b) Amides which experience a line-broadening > 90% are schematically shown as red spheres on the structure of FH19–20 (2G7I). The sizes of the spheres have been adjusted to correlate with the degree of line-broadening that each amide cross-peak experiences: Larger spheres represent complete disappearance of the signal; smaller spheres represent signals broadened by > 90% but which are still detectable. (c) Combined amide chemical shift changes upon addition of 8.5-fold excess of dp8. Blue bars indicate shift changes larger than the threshold (double the average shift change; corresponding residues mapped onto the structure of FH19–20 in Fig. 5d), white and grey bar have the same meaning as in (a).

