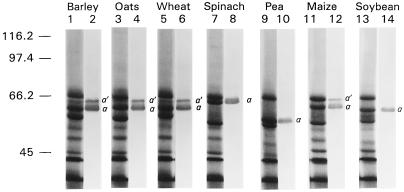
Figure 3.
Species screen of CF1 α-subunit isoforms. Thylakoids from seven species were subjected to LiDS-PAGE and immunoblot analysis. Odd-numbered lanes are gels from the indicated species that were stained for protein with Coomassie blue. Even-numbered lanes are immunoblots from the indicated species that were developed with barley 64-kD protein antisera. Lanes stained for protein contained thylakoids equivalent to 15 μg of chlorophyll. Lanes used for immunoblots contained thylakoids equivalent to 5 μg of chlorophyll. Molecular mass markers (in kD) are indicated at left.

