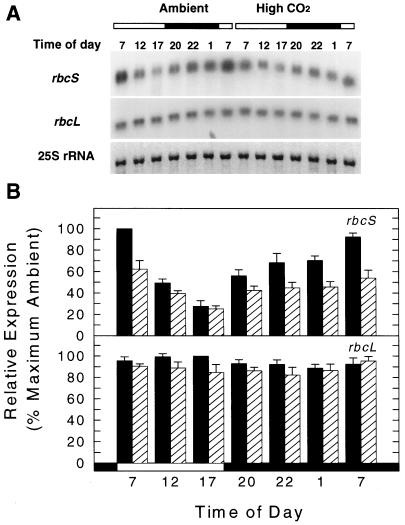
Figure 5.
Effects of transfer to elevated CO2 on the relative abundance of rbcS and rbcL transcripts during a light/dark cycle. Ambient-CO2-grown plants were transferred to elevated CO2 at the beginning of d 1, and plants were collected through the 24-h period on d 6 of exposure. A, Northern-blot analysis of rbcS and rbcL expression using 1 μg of total RNA per lane. 25S rRNA is shown stained with methylene blue. Bars above blots and at the bottom of the graph in B indicate the light regime (the filled area indicates dark, the open area indicates light). B, Quantified signals of total rbcS and rbcL transcripts from ambient-CO2-grown (black bars) and high-CO2-grown (hatched bars) plants. The hybridizing signal at 7:00 am from ambient-CO2-grown plants was defined as 100%. The diurnal transfer experiment was done twice. Values are means ± sd from four filters (two filters for each replicate).

