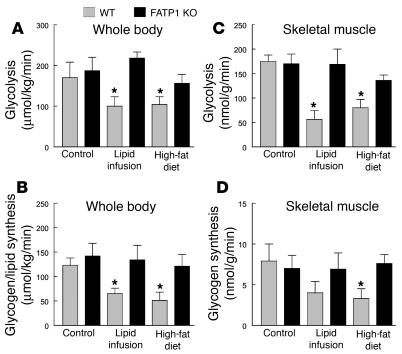
Figure 3.
Insulin-stimulated whole-body and skeletal muscle (gastrocnemius) glucose metabolic flux in WT (gray bars) and FATP1 KO (black bars) mice with lipid infusion or high-fat feeding. (A) Insulin-stimulated whole-body glycolysis in vivo. (B) Insulin-stimulated whole-body glycogen plus lipid synthesis from glucose in vivo. (C) Insulin-stimulated skeletal muscle glycolysis in vivo. (D) Insulin-stimulated skeletal muscle glycogen synthesis in vivo. Values are means ± SE for 5–6 experiments. *P < 0.05 versus WT (control) mice.

