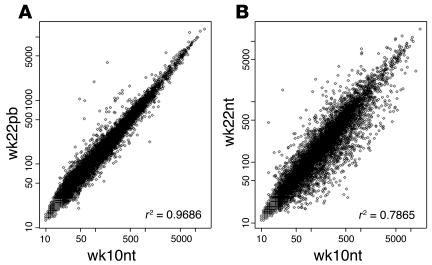
Figure 4.
Scattergrams comparing the levels of expression of 12,422 transcripts explored using MG-U74A v2 Affymetrix array in wk10nt, wk22nt, and wk22pb cRNAs from mammary glands. (A) The r2 coefficient shows a high correlation between wk22pb and wk10nt data sets. (B) The r2 coefficient fails to show any correlation between wk22nt and wk10nt data sets.

