Figure 1.
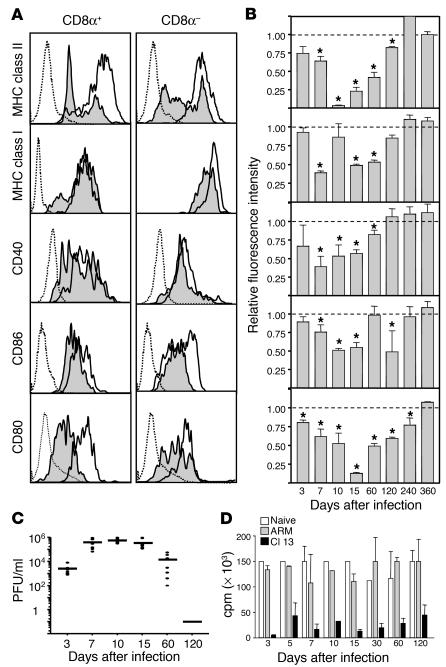
LCMV Cl 13 infection reduces the expression of cell surface molecules on splenic DCs. Labeling with anti-CD11c and -CD80 antibodies was used to distinguish between CD11c+CD8α+ and CD11c+CD8α– DCs. (A) Histograms show one of four representative experiments analyzing the expression of cell surface molecules on CD11c+CD8α+ and CD11c+CD8α– spleen DCs from Cl 13– or ARM-infected mice at day 15 after infection. Dotted histograms indicate background staining with isotype control antibodies, white histograms represent ARM-infected mice, and shaded histograms represent Cl 13–infected mice. (B) The RFI of surface molecules expressed on CD11c+CD8α+ splenic DCs from day 3 to day 360 after infection is displayed. Each bar represents the RFI of a given surface molecule on CD11c+CD8α+ spleen DCs. The RFI was calculated as indicated in Methods. Data are presented as mean ± SD. Asterisks denote a statistically significant reduction in Cl 13–infected mice compared with ARM-infected mice (Student t test, P < 0.05). (C) Viral load in serum of 5–8 Cl 13–infected mice analyzed from day 3 to day 120 after infection as determined by plaque assay. Each filled circle represents an individual mouse. The line at each timepoint represents the mean of all mice in each group. (D) The allostimulatory capacity of DCs from the spleens of either uninfected (white bars), ARM-infected (gray bars), or Cl 13–infected (black bars) mice is indicated at different timepoints after infection. DCs from infected or uninfected C57BL/6 (H-2b) mice were irradiated and used as stimulator cells for allogeneic T cells from BALB/c (H-2d) mice at a T cell/DC ratio of 5:1 in the MLR. Proliferation was measured in cpm (average cpm ± SD) after [3H]thymidine incorporation. Each bar represents the average of at least four mice.

