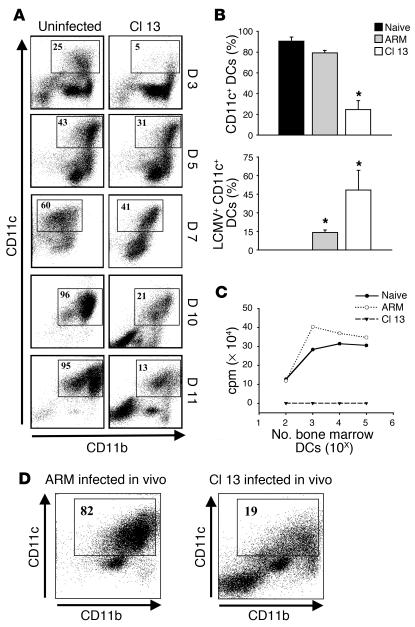
Figure 3.
Cl 13 infection of BMCs in vitro inhibits the generation of CD11c+ DCs. (A) Dot plots show CD11c and CD11b expression for uninfected and Cl 13–infected BMCs at days 3, 5, 7, 10, and 11 of culture with GM-CSF. The boxes denote the percentage of CD11c+ DCs in the cultures. Note the reduction in the percentage of CD11c+ cells in Cl 13–infected cultures when compared with uninfected cultures at all timepoints. The data shown are representative of five independent experiments. (B) The percentage of CD11c+ cells as well as the percentage of LCMV-infected CD11c+ cells is plotted for uninfected, ARM-infected, or Cl 13–infected cultures at day 11. Data are represented as the mean ± SD. Statistical differences were determined using a one-way ANOVA (P < 0.05). Asterisks denote a statistical difference from uninfected cultures. (C) The allostimulatory capacity of uninfected, ARM-infected, or Cl 13–infected BM DCs was evaluated at day 11 after culture. Log-serial dilutions (ranging from 102 to 105) of DCs were irradiated and used as stimulator cells for allogeneic T cells from BALB/c (H-2d) mice at a T cell/DC ratio of 5:1 in the MLR. Proliferation was measured in cpm after [3H]thymidine incorporation. (D) Fresh BMCs were isolated from Cl 13– or ARM-infected mice at day 15 after infection and grown for 11 days in the presence of GM-CSF. Dot plots show CD11c and CD11b expression. The boxes denote the percentage of CD11c+ DCs in the cultures.

