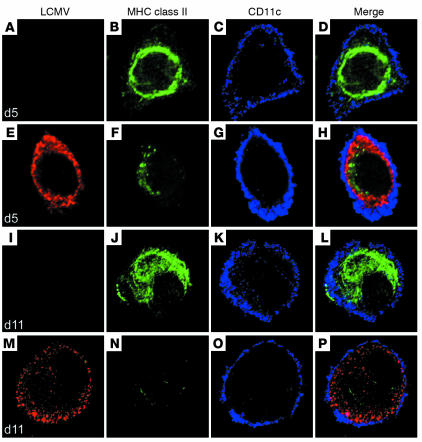
Figure 4.
Cl 13 infection inhibits the expression of MHC class II molecules on CD11c+ DCs. Confocal microscopy was used to analyze the expression of MHC class II molecules (green), CD11c (blue), and viral NP (red) on BMCs stimulated with GM-CSF in vitro. LCMV indicates cells infected with Cl 13. Panels A–D show uninfected BMCs after 5 days of culture. The same timepoint is shown in panels E–H for Cl 13–infected cells. Note the perinuclear distribution of MHC class II in uninfected DCs at day 5. A similar distribution was observed in Cl 13–infected DCs at this timepoint; however, the intensity of staining was significantly reduced. At day 11, MHC class II was detected on the plasma membrane of CD11c+ DCs in the uninfected cultures (I–L) but not on Cl 13–infected DCs (M–P). The micrographs are representative of at least three independent experiments in which a minimum of ten DCs was analyzed.

